The bull flag pattern is one of the most reliable and widely used continuation patterns in technical analysis, favored by traders for its clarity and high probability of success. It typically signals a temporary pause in a strong upward trend, providing traders with opportunities to enter the market at optimal points. In this comprehensive guide, you'll discover how to accurately identify, interpret, and effectively trade bull flag patterns, along with understanding their variations, risks, and strategic implications to enhance your overall trading performance.
Table of Contents
What Does a Bull Flag Look Like?
Different Types Of Flags You Should Keep An Eye Out For
How to find Bull Flag Patterns
How Reliable is a Bull Flag Pattern?
Advantages and Disadvantages of Bull Flag Pattern
Recognizing The Risks Associated With Trading Flag Patterns
Key Takeaways
- Continuation Signal: The bull flag pattern indicates a temporary consolidation before the prevailing uptrend resumes.
- Distinct Structure: Characterized by a sharp price rise (flagpole) followed by a downward-sloping or sideways consolidation (flag).
- Volume Dynamics: High volume during the flagpole formation and decreasing volume during consolidation, with a breakout on increasing volume, enhances pattern reliability.
- Variations: Understanding different flag patterns, including high and tight flags, bear flags, pennants, and wedges, is crucial for comprehensive technical analysis.
🔗 what
What Is a Bullish Flag?
A bullish flag is a well-known continuation pattern observed frequently in technical analysis, appearing predominantly in markets experiencing strong upward trends. This pattern provides traders with valuable insights into potential market behavior, suggesting a temporary pause or breather in the bullish momentum before the upward trend resumes. The formation of a bullish flag begins with a powerful and swift upward price movement, known as the flagpole, which is typically driven by robust buying pressure, positive market sentiment, or favorable news events.
Following this rapid price increase, the market enters a brief consolidation phase, characterized by sideways or slightly downward price movement. During this period, the price oscillates within a clearly defined channel formed by two parallel trendlines. This channel visually resembles a flag waving atop the previously established flagpole. This consolidation phase typically occurs on reduced trading volume, reflecting a brief period of profit-taking, reassessment of positions, or hesitation among traders.
Importantly, the consolidation phase within a bullish flag does not represent a reversal but rather a short-term pause within the prevailing uptrend. Traders closely observe this phase, awaiting a breakout above the upper trendline of the flag, preferably accompanied by increasing trading volume. Such a breakout acts as confirmation that bullish momentum remains intact, signaling a potentially profitable entry point for traders who anticipate further upward price movement. Proper identification and interpretation of bullish flags enable traders to capitalize effectively on strong market trends, enhancing their strategic approach to trading.
🔗 look
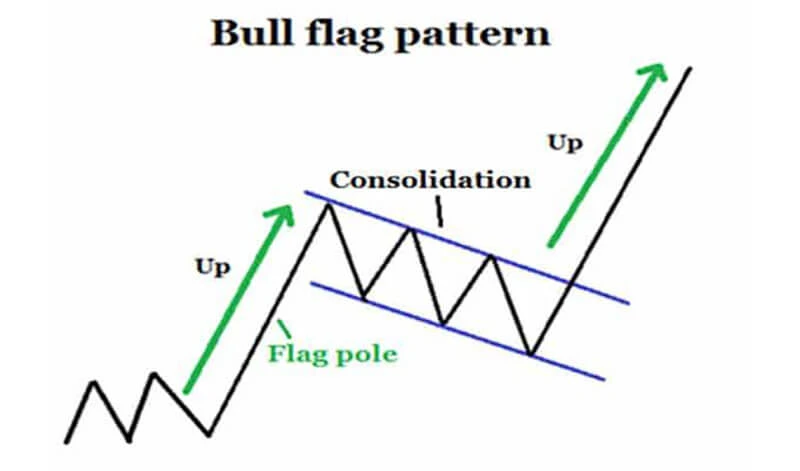
What Does a Bull Flag Look Like?
A bull flag pattern has a distinctive visual structure that traders can easily recognize on price charts. At its core, the pattern consists of two critical components that clearly depict the ongoing market sentiment. The first component is known as the flagpole, which appears as a sharp and rapid increase in price. This sharp rise usually emerges from strong buying activity, positive news, or significant bullish market sentiment. The flagpole represents robust market momentum and signals the strength of the bullish trend, capturing traders' attention due to its sudden and notable movement.
Following the formation of the flagpole, the second component—the flag—begins to take shape. This is the consolidation phase, characterized by a temporary pause or slowdown in price action. During this phase, the price typically moves sideways or gently slopes downward within a well-defined channel bounded by two parallel trendlines. The upper and lower boundaries of this consolidation channel mark a brief period of market indecision, minor profit-taking, or reassessment among market participants. It is common to see a decrease in trading volume during this stage, as traders adopt a more cautious stance, waiting for a clearer directional indication.
Importantly, while the flag may indicate uncertainty or hesitation in the market, it does not signify a trend reversal. Instead, it represents a brief pause in the prevailing bullish trend. Experienced traders pay close attention to the boundaries of the flag pattern, specifically looking for a clear breakout above the upper trendline. This breakout ideally occurs with increasing volume, providing traders with further confidence that the bullish momentum is set to resume. As soon as the price surpasses the upper boundary of the consolidation channel, it usually signals the continuation of the upward trajectory established by the original flagpole, thus confirming the bull flag pattern as a reliable indicator of ongoing bullish momentum.
🔗 eye
Different Types of Flags You Should Keep an Eye Out For
Flag patterns are pivotal in technical analysis, offering insights into potential market movements. Beyond the standard bull flag, several variations exist, each with unique characteristics and implications.
High and Tight Flags
The high and tight flag is a potent bullish continuation pattern. It begins with a sharp price surge, often doubling the asset's value within a short timeframe, forming the flagpole. This is followed by a brief consolidation phase, where the price moves sideways or slightly downward, creating the flag. This pattern suggests strong bullish momentum and often precedes significant upward breakouts.
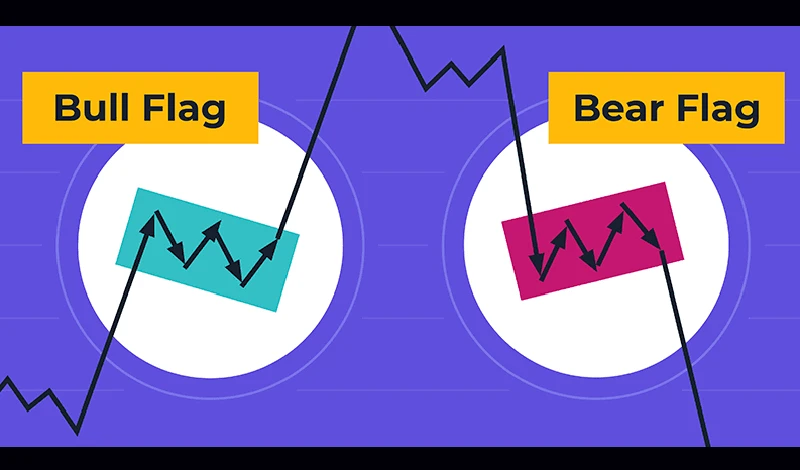
Bull Flags
As previously discussed, the bull flag is a continuation pattern indicating a pause before the uptrend resumes. It's characterized by a steep rise (flagpole) followed by a downward-sloping or horizontal consolidation (flag). The breakout from this consolidation typically signals the continuation of the bullish trend.
Bear Flags
In contrast, a bear flag is a bearish continuation pattern. It starts with a sharp price decline (flagpole) followed by a consolidation phase where the price moves upward or sideways within parallel lines, forming the flag. This pattern suggests a temporary pause before the downtrend continues.
Pennant Flags
Pennant flags are similar to flag patterns but have a triangular shape during the consolidation phase. After a significant price movement (flagpole), the price consolidates within converging trendlines, forming a pennant. This pattern can be bullish or bearish, depending on the preceding trend, and typically leads to a breakout in the direction of that trend.
Wedge Flags
Wedge flags are continuation patterns where the consolidation phase forms a wedge shape, with trendlines converging. Depending on the direction of the wedge and the preceding trend, wedges can indicate either continuation or reversal. In the context of flag patterns, a wedge that follows a strong price movement and slopes against the prevailing trend may signal a continuation upon breakout.
Understanding these variations enhances a trader's ability to interpret market signals and make informed decisions.
🔗 buy
When to Buy a Bull Flag
Identifying the right entry point is critical to trading the bull flag pattern successfully. Traders typically look for specific conditions that confirm the bullish continuation. Here are some optimal scenarios to consider:
Ideal Conditions for Buying Bull Flags
- Breakout Confirmation:
- Enter the trade when the price breaks above the upper resistance line of the flag. Ensure that the breakout occurs with increasing volume, signaling genuine buyer interest and momentum.
- Retest of Breakout Level:
- Another strategic entry is during a retest of the resistance line after the initial breakout. If the price successfully tests this level and continues upward, it provides additional confirmation of bullish momentum.
- Strong Volume Support:
- Confirm the breakout by observing volume increases at the point of breakout. Higher-than-average volume confirms strength in buying activity, reducing the risk of false breakouts.
Bull Flag Entry Checklist
Use the following checklist to confirm your trade entry:
| Condition | Confirmation |
| Preceding Uptrend | Strong upward move (flagpole formation) |
| Consolidation Pattern | Clear downward-sloping or sideways flag |
| Volume Analysis | Declining volume during flag formation |
| Breakout Occurs | Price clearly breaks above resistance |
| Volume at Breakout | Increasing and above average |
🔗 find
How to Find Bull Flag Patterns
Locating bull flag patterns involves careful analysis and observation. Here’s a step-by-step guide to help you find them efficiently:
Step 1: Identify the Flagpole
- Look for a strong, rapid upward price move. This price spike represents significant buying pressure and usually occurs on high volume.
Step 2: Identify the Flag Formation
- After the sharp move upward, the price will typically consolidate in a downward-sloping or horizontal channel, forming the "flag."
- Use trendlines to clearly mark the top and bottom of this consolidation.
Step 3: Confirm the Volume Pattern
- Volume should decrease during the flag formation, indicating reduced selling pressure and temporary market indecision.
Step 4: Spot the Breakout
- The bullish continuation is confirmed when the price breaks out above the upper resistance of the flag on increasing volume.
Tools to Help Identify Patterns
- Technical Indicators:
- Indicators such as moving averages (e.g., 20-period and 50-period EMAs) can help confirm trends and identify flags effectively.
- Charting Software:
- Platforms like MT4 and MT5 (both offered by NordFX) facilitate detailed technical analysis, making it easier to spot and track patterns.
- Scanners and Screeners:
- Utilize automated pattern-recognition tools that can scan markets for bull flags efficiently.
🔗 reliable
How Reliable Is a Bull Flag Pattern?
The bull flag pattern is widely regarded as one of the most reliable continuation patterns in technical analysis. Its reliability stems primarily from the clarity of its structure and the strength of the underlying market momentum it represents. However, it is essential for traders to recognize that, while bull flags generally indicate strong bullish sentiment, their effectiveness and reliability can fluctuate depending on several critical factors. Understanding these factors helps traders differentiate between high-probability opportunities and weaker signals that may result in false breakouts or failed trades.
One of the primary factors influencing the reliability of a bull flag pattern is the strength of the initial trend, commonly referred to as the flagpole. A strong, sharp, and clearly defined upward price move usually signals robust buyer commitment and increased market momentum. Such forceful price moves reflect significant institutional or retail participation, indicating the presence of genuine bullish conviction. Conversely, if the flagpole appears weak, choppy, or lacks clear direction, it suggests weaker momentum and reduces the reliability of the subsequent bull flag pattern.
Another crucial determinant of bull flag reliability is the pattern’s volume dynamics. Typically, a reliable bull flag is characterized by high trading volume during the formation of the flagpole, followed by declining volume during the consolidation phase. This reduction in volume suggests a temporary pause or minor profit-taking rather than a full reversal. Most importantly, a confirmed breakout from the consolidation channel should be accompanied by rising trading volumes. An increase in volume upon breakout reinforces the bullish signal, indicating renewed buyer interest and reducing the likelihood of a false breakout.
The duration of the consolidation phase also plays a significant role in determining the reliability of a bull flag pattern. Generally, shorter consolidation periods tend to yield more reliable continuation moves, as they reflect a brief pause in the ongoing bullish momentum rather than sustained indecision. Extended consolidations, while not necessarily invalidating the pattern, often indicate weaker momentum and can reduce the effectiveness of the breakout. Shorter flags, lasting from a few days to a couple of weeks depending on the timeframe, usually suggest stronger underlying bullish sentiment and thus provide traders with a clearer and more reliable signal for market entry.
Reliability Rating Table
| Factor | Reliability Impact |
| Strong Upward Move | High Reliability |
| Decreasing Consolidation Volume | High Reliability |
| Clear Breakout | High Reliability |
| Weak or Choppy Trend | Low Reliability |
| Volume not Confirming Breakout | Low Reliability |
🔗 adv
Advantages and Disadvantages of the Bull Flag Pattern
Like any technical chart pattern used by traders, the bull flag pattern comes with its unique set of advantages and disadvantages. Understanding these pros and cons thoroughly can significantly enhance a trader's effectiveness, allowing them to leverage the benefits of the bull flag while carefully managing its associated risks.
Among the notable advantages of the bull flag pattern is the clear definition it provides for entry and exit points. Traders can easily identify the precise moment when a breakout occurs above the upper boundary of the consolidation channel. This clarity helps in establishing exact entry points, setting realistic profit targets based on the length of the flagpole, and determining suitable stop-loss levels below the consolidation phase. Such clear and straightforward guidance significantly reduces ambiguity, enabling traders to execute their trading plans with confidence and precision.
Another advantage is the bull flag pattern’s historical reliability as a continuation signal. The pattern is widely favored by traders precisely because it tends to accurately predict the continuation of the preceding upward trend. Its frequent occurrence across various markets and timeframes makes it a trusted tool within technical analysis. Additionally, the bull flag often offers a favorable risk-reward ratio, allowing traders to set tighter stops just below the flag’s consolidation area while targeting profit levels significantly higher. This advantageous risk management setup often enhances overall profitability in the long term.
Despite these benefits, the bull flag pattern also carries several disadvantages that traders must remain vigilant about. One significant drawback is the possibility of false breakouts. Even with strong technical signals, the market may occasionally fail to continue upward after initially breaking out of the consolidation channel. Such false signals can result in losses if traders are not disciplined in managing their positions and adhering strictly to predetermined stop-loss levels.
Another challenge associated with bull flags is the inherent subjectivity involved in identifying precise flag boundaries. Different traders may interpret the consolidation phase differently, potentially leading to varied entry and exit points and inconsistent results. Because chart patterns are rarely perfect, minor deviations or ambiguous price movements can cause uncertainty, leading some traders to make premature or delayed trading decisions.
Lastly, the bull flag pattern’s dependency on trading volume can also pose a significant risk. While increased volume typically confirms the validity of a breakout, breakouts on low or diminishing volume can result in misleading signals. Without adequate volume confirmation, traders risk entering trades that lack sufficient market momentum to sustain upward movement, thereby increasing the potential for unfavorable outcomes or market reversals.
Being mindful of these advantages and disadvantages enables traders to more effectively leverage the bull flag pattern, maximizing its profitability while carefully managing potential risks.

🔗 risks
Recognizing the Risks Associated with Trading Flag Patterns
Understanding potential risks when trading bull flag patterns is crucial for effective risk management:
Key Risks to Be Aware Of
- False Breakouts:
- The primary risk associated with bull flag patterns is false breakouts. Price may temporarily break the resistance and reverse immediately, triggering stop losses.
- Market Volatility:
- Sudden market volatility or unexpected news events can invalidate a bull flag pattern and rapidly change market sentiment.
- Inaccurate Pattern Identification:
- Misidentification or overly subjective interpretation can lead to poor entries and losses.
Risk Management Strategies
| Risk | Strategy |
| False Breakouts | Wait for volume confirmation, set tighter stop losses |
| Market Volatility | Use trailing stops or smaller position sizes |
| Pattern Misidentification | Combine with other technical indicators for confirmation |
Frequently Asked Questions (FAQ)
What timeframe is best for identifying bull flag patterns?
Bull flag patterns can appear on various timeframes, from 1-minute charts to daily or weekly charts. Shorter timeframes suit day traders, while longer timeframes are preferred by swing or position traders.
Can bull flag patterns appear in bear markets?
While primarily bullish continuation patterns, bull flags may appear as short-term retracements in larger downtrends. However, their reliability diminishes in bearish market conditions.
How do I measure the profit target of a bull flag pattern?
Profit targets are usually measured by projecting the length of the flagpole from the breakout point upward. This provides an approximate level where price may reach after the breakout.
What’s the ideal duration for a bull flag consolidation?
Typically, a bull flag consolidation phase lasts anywhere from several days to three weeks, depending on the timeframe analyzed. Longer consolidations may weaken reliability.
Should I always wait for breakout confirmation?
Yes. It is strongly recommended to wait for price breakout confirmation accompanied by strong volume before entering trades to avoid false signals.
Disclaimer: These materials are not an investment recommendation or a guide for working on financial markets and are for informational purposes only. Trading on financial markets is risky and can lead to a complete loss of deposited funds.
Go Back Go Back
