Minggu 4–8 Mei menghadirkan volatilitas tinggi di semua instrumen. Tema dominan adalah konflik AS–Iran dan krisis Selat Hormuz, diselingi rilis Nonfarm Payrolls April yang lebih kuat dari perkiraan (115K vs. prakiraan 62K) pada hari Jumat. Pasar juga memproses ancaman Trump atas tarif tambahan terhadap Uni Eropa pada 4 Juli, penurunan ISM Services PMI ke 53,6, dan Sentimen Konsumen University of Michigan yang turun ke 48,2. Kerangka makro yang berlaku menjelang pekan baru: The Fed tetap bertahan di 3,50–3,75%, ECB bergeser ke arah potensi kenaikan suku bunga pada Juni (50 bps kini dihargakan untuk akhir tahun, probabilitas 75% untuk kenaikan di Juni), dan Selat Hormuz tetap tertutup meskipun ada memorandum perdamaian AS yang dikirim melalui mediator Pakistan — respons Teheran diperkirakan pada awal minggu mendatang. Minggu 11–15 Mei membawa kalender makro berdampak tinggi: CPI AS April (Selasa, 12 Mei), PPI (Rabu, 13 Mei), Retail Sales (Kamis, 14 Mei), IEA STEO (Selasa), dan risalah rapat ECB April. Rilis CPI menjadi peristiwa utama untuk keenam instrumen.
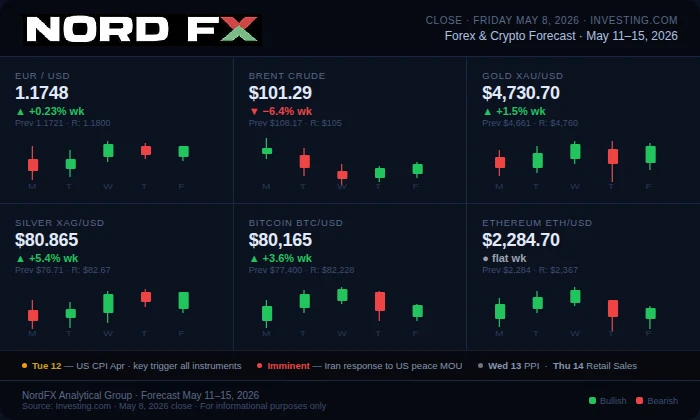
Harga penutupan per Jumat, 8 Mei 2026:
EUR/USD – 1.1748 | Brent Crude Oil Futures – $101.29 | Gold Futures (GC) – $4,730.70 | Silver Futures (SI) – $80.865 | Bitcoin (BTC/USD) – $80,165 | Ethereum (ETH/USD) – $2,284.70
EUR/USD
EUR/USD ditutup di 1.1748, naik +0,23% dalam sepekan (dari 1.1721). Pasangan ini menghabiskan minggu dengan menguji batas 1.1800 tanpa menutup di atasnya, didukung oleh sikap hawkish ECB dan pelemahan dolar karena harapan perdamaian Iran, sementara ancaman tarif Trump terhadap UE dan NFP yang kuat membatasi kenaikan. Harga bertahan nyaman di atas SMA 20-hari (~1.1737) dan SMA 100-hari (~1.1709), dengan SMA 200-hari di 1.1682 sebagai lantai struktural. Ekspektasi pengetatan ECB (50 bps dihargakan pada akhir tahun, probabilitas kenaikan 75% pada Juni) menjadi pendorong utama EUR jangka menengah. Pemicu utama: CPI AS April (Selasa). CPI panas (≥3,5% YoY) → USD menguat, mendorong EUR/USD ke 1.1650–1.1620. CPI lemah (≤3,0%) → menghidupkan kembali taruhan penurunan suku bunga, target 1.1800–1.1850. Respons perdamaian Iran adalah variabel liar: balasan positif → 1.1850–1.1900; eskalasi baru membalik keduanya. Resistance: 1.1800, 1.1840, 1.1900. Support: 1.1720, 1.1682, 1.1640.
Pandangan dasar: Sedikit bullish di atas 1.1720. Selisih suku bunga ECB vs. The Fed memberi dukungan struktural. Batas 1.1800 tetap menjadi hambatan utama; penutupan harian di atasnya membuka 1.1840–1.1900. CPI AS dan respons Iran menjadi pemicu biner. Skenario dasar: kisaran 1.1720–1.1800 sampai salah satu pemicu tersebut aktif.
Brent Crude Oil
Brent ditutup di $101.29, mencatat penurunan mingguan pertama (−6,4%) sejak Selat Hormuz ditutup pada akhir Februari (dari $108.17). Pekan ini menyaksikan ayunan intraday yang ekstrem: tertinggi $108.80 pada Senin (eskalasi Operation Project Freedom) jatuh ke $96.80 intraday pada Rabu (Axios melaporkan AS hampir mencapai MOU perdamaian 14 poin dengan Iran), sebelum pulih ke $101.29. IEA memperkirakan konflik ini menghilangkan sekitar 14 juta barel per hari dari pasokan global. Dated Brent (pengiriman fisik) diperdagangkan di atas $130/bbl, mencerminkan tekanan pasar fisik yang parah yang tidak sepenuhnya tercermin di futures. Pemicu utama: respons Iran terhadap MOU perdamaian AS (diperkirakan segera). Balasan positif → pergerakan cepat $10–18 menuju $85–90 (meski kelangkaan fisik dan kerusakan infrastruktur akan memperlambat penurunan). Penolakan/eskalasi → uji ulang $108–$114. Respons ambigu (skenario dasar) → kisaran $98–$108. Juga pantau IEA STEO (Selasa) dan persediaan EIA mingguan (Rabu). Resistance: $105, $108, $114. Support: $98, $95, $90.
Pandangan dasar: Netral dengan ketidakpastian biner yang ekstrem. Arah sepenuhnya ditentukan oleh diplomasi. Skenario dasar: kisaran $98–$108 selama pembicaraan berlanjut tanpa kesepakatan final. Kesepakatan damai yang terkonfirmasi adalah satu-satunya pemicu yang mampu membawa harga cepat ke $85–90; eskalasi baru menargetkan kembali $114.
Gold (XAU/USD)
Gold Futures (GC) ditutup di $4,730.70 (penutupan sebelumnya $4,710.90; rentang harian $4,682.50–$4,759.21), mencatat kenaikan mingguan sekitar 1,5% dari $4,661.40 – kenaikan mingguan pertama dalam tiga minggu. Harga merebut kembali level psikologis $4,700 dan kini menguji SMA 40-periode pada grafik H1, dengan Daily MACD menunjukkan konvergensi bullish awal. Rentang 52 minggu berada di $3,123–$5,627. Paradoks inti emas tetap ada: krisis Hormuz mendorong permintaan safe haven dan inflasi berbasis minyak, yang menunda pemotongan suku bunga dan menekan emas yang tidak menghasilkan imbal hasil. The Fed memiliki probabilitas 94,9% untuk tetap menahan suku bunga pada Juni (CME FedWatch). Pemicu utama: CPI AS April (Selasa). CPI panas → menekan menuju $4,650–$4,600. CPI lemah → menghidupkan kembali ekspektasi pemotongan, target $4,800–$4,840. PPI (Rabu) dan Retail Sales (Kamis) memberikan sinyal tambahan. Kesepakatan Hormuz bersifat negatif jangka pendek bagi emas (minyak/inflasi turun, USD menguat) tetapi positif jangka menengah (jalur pemotongan suku bunga terbuka kembali). Resistance: $4,760, $4,800, $4,840. Support: $4,700, $4,650, $4,600.
Pandangan dasar: Netral ke sedikit bullish di atas $4,700. Pemulihan minggu ini secara teknis konstruktif; lantai $4,700 bertahan dan Daily MACD membaik. Penutupan di atas $4,760 menargetkan $4,800–$4,840 (konsensus jangka menengah: Goldman Sachs $5,400, JPMorgan $5,900 akhir tahun). Penembusan di bawah $4,650 membuka kembali $4,600–$4,560.
Silver (XAG/USD)
Silver Futures (SI) ditutup di $80.865, naik mingguan +5,4% dari $76.71 — kinerja mingguan terkuat dari enam instrumen yang dibahas. Perak melonjak lebih dari 6% pada Rabu saja karena optimisme perdamaian Iran. Harga berada pada level tertinggi sejak pertengahan April. SMA 200-hari (~$75.23) telah beralih menjadi support; SMA 50-hari (~$82.67) kini menjadi target di atasnya. Ringkasan teknikal Investing.com memberi XAG/USD peringkat "Strong Buy" pada semua kerangka waktu utama, dengan pivot $79.20 sebagai support rotasional kunci. Pemicu utama: CPI AS (Selasa). CPI lemah + kemajuan Hormuz → target SMA 50-hari di $82.67 dan lebih tinggi. CPI panas + eskalasi → membuka $79.20–$77.00. Lantai struktural: permintaan industri terkait AI (belanja modal Big Tech $715B, +91% YoY) menopang permintaan perak untuk semikonduktor dan pusat data. Resistance: $82.00, $84.00, $86.00. Support: $79.20, $77.00, $75.00.
Pandangan dasar: Bullish di atas $79.20. Pemulihan kuat minggu ini, peringkat teknikal Strong Buy di Investing.com, dan SMA 200-hari yang kini menjadi support menegaskan bias bullish. Target berikutnya: SMA 50-hari di $82.67. CPI panas atau eskalasi yang menembus $79.20 akan membatalkan setup ini.
Bitcoin (BTC/USD)
Bitcoin diperdagangkan di $80,165 pada pembaruan pukul 8:06 PM UTC tanggal 8 Mei, dengan aksi harga mingguan dimulai dari pembukaan Senin di $76,960 hingga tertinggi mingguan $82,000 (6 Mei — tertinggi sejak Januari), sebelum terkoreksi menjelang penutupan. Kenaikan mingguan dibanding Jumat sebelumnya $77,400 adalah +3,6%. EMA 200-hari di $82,228 membatasi harga dua kali dan tetap menjadi level breakout teknikal yang menentukan. On-chain: cadangan di bursa berada di titik terendah 7 tahun; IBIT milik BlackRock memegang sekitar 812,000 BTC (~$62B); arus masuk ETF kumulatif $58.5B. Dompet whale diperkirakan membeli bersih 270,000 BTC selama 30 hari — akumulasi bulanan terbesar sejak 2013. Pemicu utama: CPI AS (Selasa) — rilis lemah mendukung aset berisiko secara luas. CLARITY Act (kerangka regulasi kripto) yang maju di Kongres adalah positif jangka menengah. Kesepakatan damai Iran = dorongan risk-on untuk BTC. Penutupan harian yang terkonfirmasi di atas $82,228 memicu pembalikan tren struktural dan membuka $84,000–$86,000. Resistance: $82,228 (EMA 200-hari), $84,000, $86,000. Support: $80,000, $78,500, $76,960.
Pandangan dasar: Bullish di atas $80,000. Pasokan di bursa yang mencapai rekor terendah, akumulasi whale yang historis, dan arus masuk ETF $58.5B mewakili permintaan struktural terkuat sejak akhir 2024. EMA 200-hari di $82,228 adalah level breakout yang menentukan; penutupan yang terkonfirmasi di atasnya membuka $84,000–$86,000. Sampai level itu ditembus, harapkan osilasi $78,500–$82,228.
Ethereum (ETH/USD)
Ethereum ditutup di $2,284.70 (menurut penutupan sebelumnya di Investing.com; rentang harian $2,304–$2,318), pada dasarnya datar dibanding penutupan Jumat sebelumnya di $2,284, menutupi minggu yang volatil: ETH melonjak ke sekitar $2,412 (tertinggi sejak 27 April) pada Rabu karena optimisme perdamaian sebelum dijual turun hingga penutupan. EMA 50-hari (~$2,361) dan MA 200-hari (~$2,367) telah berkumpul menjadi klaster resistensi sempit selebar $6 yang telah membatasi setiap reli ETH selama berminggu-minggu. Dua hambatan tambahan minggu ini: exploit senilai $5.9M pada TrustedVolumes dan $30.8M ETH yang dibekukan (peretas Korea Utara di Arbitrum) — keduanya tidak sistemik, tetapi menekan ETH dibanding BTC. Pemicu utama: CPI AS (Selasa). CPI lemah → ETH kembali menuju resistensi $2,361–$2,367; penutupan di atas level itu membuka $2,412–$2,460. CPI panas → membuka $2,211 (EMA 50-hari, floor Mei kritis yang disorot oleh beberapa analis); penutupan di bawah $2,211 membuka $2,108 dan $2,000. ETH memiliki beta yang lebih tinggi daripada BTC ke dua arah. Resistance: $2,361, $2,367 (klaster MA), $2,412, $2,460. Support: $2,250, $2,211, $2,108.
Pandangan dasar: Netral dengan bias positif tipis di atas $2,250. ETH terjebak di antara support $2,250–$2,250 dan klaster resistensi MA $2,361–$2,367. CPI lemah adalah pemicu paling mungkin untuk menembus ke atasnya; keberhasilan menargetkan $2,412–$2,460. Kesepakatan damai Hormuz = dorongan risk-on yang luas. Harus mempertahankan $2,211 pada setiap penurunan untuk menjaga struktur Mei.
Kesimpulan
Minggu 11–15 Mei dibingkai oleh dua variabel utama: CPI AS April (Selasa) dan respons Iran terhadap memorandum perdamaian AS (diperkirakan segera). Bersama-sama, dua peristiwa ini akan menentukan apakah narasi suku bunga berbasis inflasi melunak atau mengencang, dan apakah guncangan pasokan Hormuz mulai mereda atau justru menguat. CPI adalah pemicu sentral untuk semua enam instrumen: data lemah menghidupkan kembali ekspektasi pemotongan suku bunga (EUR/USD naik, emas naik, perak naik, kripto naik, minyak lebih moderat); data panas memperkuat sikap The Fed yang menahan suku bunga (USD lebih kuat, hambatan bagi logam mulia dan kripto). Hasil Hormuz adalah pendorong utama untuk Brent, dengan dampak lanjutan signifikan ke emas, perak, dan aset berisiko. EUR/USD membutuhkan penembusan CPI dan keringanan tarif UE untuk menembus 1.1800 secara meyakinkan. Brent menghadapi titik balik diplomatik paling signifikan sejak perang dimulai. Emas telah merebut kembali $4,700 dan mengincar $4,760–$4,840 jika CPI lemah. Minggu kuat perak (+5,4%) telah membentuk posisi bullish dengan SMA 50-hari ($82.67) sebagai target berikutnya. Pasokan bursa Bitcoin yang mencapai rekor terendah dan akumulasi whale menjaga permintaan struktural tetap utuh, dengan $82,228 sebagai level breakout penentu. Ethereum akan memperbesar pergerakan ke arah mana pun sentimen risiko pecah, dengan klaster MA $2,361–2,367 dan $2,211 sebagai batas penentu.
NordFX Analytical Group
Penafian: Materi ini bukan rekomendasi investasi atau panduan untuk beroperasi di pasar keuangan dan hanya untuk tujuan informasi. Trading di pasar keuangan berisiko dan dapat menyebabkan hilangnya seluruh dana yang disetorkan.
Kembali Kembali
