There are currently a huge variety of profitable trading strategies in the financial markets that are based on the latest scientific developments. Everyone dreams of opening the veil of the future, of predicting the behavior of financial instruments accurately. After all, both personal well-being and sometimes the success of an investment organization that operates with impressive resources depend on this. Impulse-based indicators and oscillators are among the most important and reliable technical analysis tools.
What is Forex Impulse
Impulse is a change in the price of a financial instrument over a fixed period of time. This definition is essentially an analogue of speed, that is, the distance traveled within a certain time. For example, today's 9-day momentum value M equals the difference between today's price and the price 9 days ago.
It is sometimes very convenient to represent different instruments in the same notation system. Impulse is expressed as a percentage for this purpose. For example, a one-day impulse equals a profit or loss expressed as a percentage of the original price.
In essence, impulse values are used to smooth price levels and can be a fairly reliable trend indicator. Naturally, impulse is not as smooth as the corresponding moving average values, but the main advantage is the absence of delays that occur inevitably when using moving averages.

Impulse as a Trend Indicator
Since the impulse value is a smoothed price difference (smoothed value of price changes), impulse can serve to determine price trends in the same way as a moving average. It is noted that the larger the interval used when calculating the n-day impulse, the smoother the results will be.
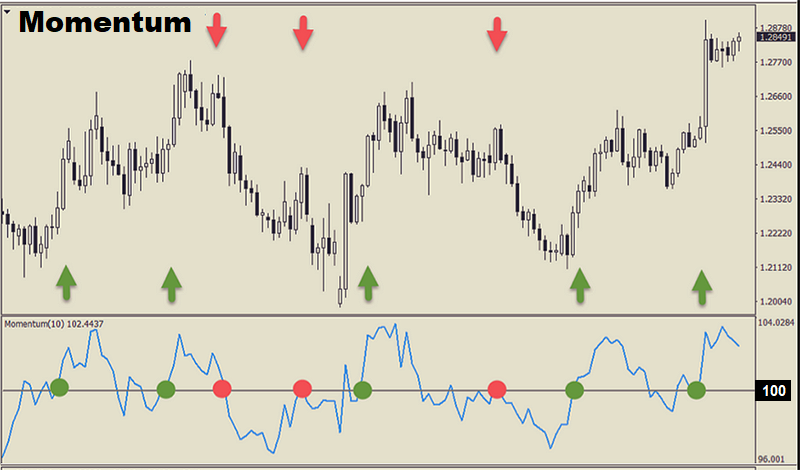
The Metatrader-4 trading terminal already has a convenient and simple Momentum impulse indicator, with values fluctuating around the average line of 100. The transition of the indicator value through this line above 100 means a trend change from downtrend to upward (buy signal) and vice versa, falling below 100 gives a sell signal. It is also possible to build a protective horizontal bar above and below the 100 value to filter out false signals.
You can see in the chart one of the examples of the practical use of the Momentum impulse indicator (the calculation finds the difference over 10 periods).
The user can change the impulse calculation period, change the color and design of the indicator line, pin the maximum and minimum values, assign the opening and closing prices used in the calculations as well as lows and highs on the selected timeframe.
Naturally, the best interval for calculations should be selected empirically based on historical data, taking into account the characteristics of a particular financial instrument. Some traders also use parameters such as “rate of change” or “acceleration” of price movements in their calculations, which is a good identifier for side trends. After all, if the “speed” and “acceleration” of the price movement are near zero, then this is a clear sign of a flat.
Choosing When You Enter the Trade
There is a perception that impulse based strategies are convenient enough to choose when to enter the trade after minor corrections within the main trend movement. Faster, shorter period indicators respond to small price changes, while longer period indicators stay above or below the midline until the trend ends.
For example, in medium-term trading, you choose a shorter interval for calculating the impulse (for example, 6 or 5 days), which works in combination with a longer period (ranging from 30 to 50 days). Using these indicators together can result in identification of excellent opportunities for opening a position. The shorter indicator will signal the possibility of entering the market in the direction of a long-term trend after a correction.
Trading at Extremes
Another rather interesting way of using impulse based indicators is to identify oversold and overbought points of a financial instrument. This method is to identify the relative peaks of the impulse value on historical data.
It is believed that the values of the impulse indicators are limited in both positive and negative zones by the maximum movement possible for a given time cycle, which represents the indicator calculation period. After all, it is common knowledge that an overbought market means the dwindling power of the bulls, which are unable to support the upward movement. And as a result, there is an inevitable downward reaction and, if oversold, an upward reaction.
The essence of the method is to plot horizontal lines above and below zero on the impulse indicator chart to identify price extremes. You can set the position of these lines visually or choose a percentage of the maximum possible indicator value. Or, for example, you can position the lines so that only 5% of the indicator values remain above or below the band.
Stop orders when Using Impulse Strategies
Since trading in financial markets involves significant risk, you should certainly be concerned about limiting possible losses, because everyone knows that risk management issues remain among the most important issues for any trading system to succeed. It is recommended to place a protective stop order above the maximum possible value of the pulse indicator or below the minimum in a trend system. You can also use trailing stops to follow the trend.
In addition, you can set breakout levels in the form of horizontal lines at regular intervals and prevent the price movement from breaking through these levels on a pullback using stops.
***
There is a huge variety of both impulse-based indicators and strategies for their application, which have been described by many publications. In addition, for those wishing to study this issue in more detail, we can recommend the book by William Blau "Momentum, Direction and Divergence."
And of course, you can test all ideas at NordFX on a training demo account without any financial risk.
திரும்பிச் செல்லவும் திரும்பிச் செல்லவும்
