In the world of technical analysis, chart patterns play a crucial role in helping traders anticipate market movements. Among the lesser-known yet powerful formations is the diamond chart pattern—a rare but significant indicator of potential trend reversals. Recognizing this unique pattern can offer valuable insights, especially when markets show signs of exhaustion after a strong directional move. In this guide, we’ll break down the diamond chart pattern from identification to execution, equipping you with the knowledge needed to spot and trade it with confidence.
Table of Contents
What Is a Diamond Top Formation?
How to Identify Diamond Patterns on Trading Charts
How Does the Diamond Chart Pattern Work?
When Is a Diamond Top Chart Pattern Formed?
What Does a Diamond Chart Pattern Indicate?
How to Trade When You See a Diamond Chart Pattern
Key Characteristics of the Diamond Chart Pattern
Tools and Resources for Confirming the Diamond Pattern
Significance of the Diamond Chart Pattern in Technical Analysis
How Reliable Is the Diamond Chart Pattern as a Trading Indicator?
Limitations of the Diamond Formation
Potential Risks of Using Diamond Chart Patterns for Trading Decisions
Common Mistakes Traders Make When Interpreting the Diamond Chart Pattern
Key Takeaways
- The diamond chart pattern often signals a reversal in the prevailing trend, making it a valuable tool for traders seeking to anticipate market shifts.
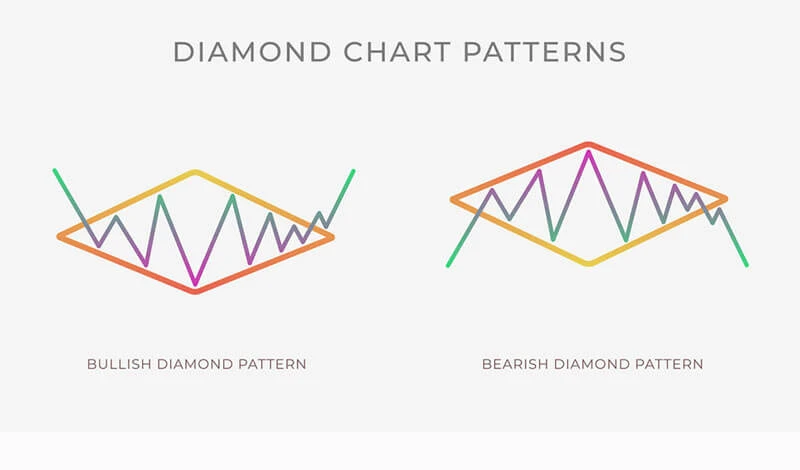
- Characterized by a broadening formation followed by a symmetrical narrowing, the pattern resembles a diamond shape on the chart.
- Successful trading of the diamond pattern involves identifying the formation, confirming the breakout direction, and implementing appropriate risk management techniques.
- Volume analysis can enhance the reliability of the pattern, with decreasing volume often observed during the formation and a surge upon breakout.
- While commonly observed in stock markets, the diamond pattern is also applicable in forex, commodities, and cryptocurrency markets.
🔗 Formation
What Is a Diamond Top Formation?
A diamond top formation is a distinctive chart pattern in technical analysis that signals a potential shift from an uptrend to a downtrend. It usually forms after a strong upward price movement, where bullish momentum starts to weaken and market participants begin to exhibit indecision. The resulting price action creates a symmetrical structure that visually resembles a diamond when outlined with trendlines.
This pattern develops in two main phases. The first is a broadening phase, where price volatility increases. During this stage, the asset forms a series of higher highs and lower lows, creating a widening appearance on the chart. This suggests growing uncertainty and a struggle between buyers and sellers, with neither side clearly dominating.
The second phase is a contracting phase, where the price starts to form lower highs and higher lows. This narrowing of the trading range reflects consolidation, as the market becomes increasingly balanced and prepares for a significant move. Once the price breaks below the lower boundary of the formation—typically a trendline connecting the recent higher lows—it signals a potential bearish reversal.
The diamond top is often seen as a warning that the existing uptrend is losing steam and that a downward correction or new downtrend could be imminent. Traders watch this pattern closely, as the breakout direction and accompanying volume can provide strong clues for strategic entry and exit points.
🔗 Identify
How to Identify Diamond Patterns on Trading Charts
Identifying a diamond pattern requires a close examination of the price chart, focusing on both the structure of the price movements and the behavior of volume during the pattern’s formation. This pattern stands out due to its unique shape, but because it forms over time, traders must observe carefully and apply specific criteria to confirm its presence.
Preceding Trend
The diamond pattern does not appear randomly on a chart; it typically emerges after a strong directional move. For a diamond top, the market must be in a clear uptrend before the pattern begins to form. Conversely, a diamond bottom follows a sustained downtrend. This prior trend is crucial, as the pattern’s significance is based on its potential to signal a reversal of the existing trend.
Broadening Formation
The initial phase of the diamond is characterized by increasing volatility. Prices move in a wider range, creating higher highs and lower lows. This expansion indicates growing uncertainty and a potential battle between bulls and bears. The chart begins to form a megaphone-like shape in this stage.
Symmetrical Contraction
Following the period of expansion, the market begins to consolidate. Price action becomes more confined, forming lower highs and higher lows. This narrowing of the price range reflects a decrease in volatility and a temporary equilibrium in buying and selling pressure. Visually, this creates a triangular shape that converges toward the center of the earlier broadening formation.
Trendline Convergence
To visually confirm the pattern, traders can draw two trendlines: one connecting the swing highs and another connecting the swing lows. In a valid diamond formation, these lines should first diverge and then converge, enclosing the price action within a symmetrical diamond-like figure. The structure should be reasonably balanced, though perfect symmetry is not required.
Volume Analysis
Volume plays an important role in validating the pattern. During the early expansion phase, volume often rises with increased activity. As the pattern progresses into the contraction phase, volume tends to decrease, reflecting uncertainty and reduced participation. A sharp increase in volume at the breakout point—whether upward or downward—can confirm the direction of the move and improve the reliability of the signal.
Recognizing a diamond pattern is not just about spotting the shape, but also about understanding the sequence of events and the context in which it forms. Paying attention to these five criteria can help traders avoid misidentifying the pattern and instead use it effectively in their trading strategy.
🔗 Work
How Does the Diamond Chart Pattern Work?
The diamond chart pattern develops as a result of changing sentiment and momentum within the market. It captures a transition phase where the strength of the current trend begins to weaken and a potential reversal starts to emerge. This shift is reflected through a distinct sequence of price movements that form a wide-to-narrow structure on the chart.
At the beginning of the pattern, the price action becomes erratic, often driven by uncertainty or strong opposing pressures from buyers and sellers. This leads to an expansion in the trading range, where price swings become broader, making higher highs and lower lows. This phase typically signals that the established trend is losing control and that market participants are reacting unpredictably to new information or technical levels.
As the pattern evolves, the wide swings start to settle, and the range of price movements begins to tighten. The market enters a period of consolidation, where each new high is lower than the previous one, and each new low is higher than the previous one. This contraction phase suggests that neither buyers nor sellers have a clear advantage, and the market is preparing for a breakout.
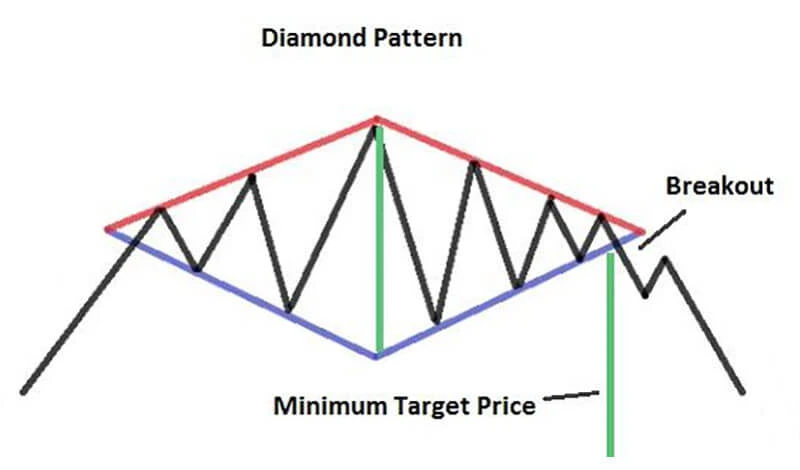
The direction of the breakout determines the future trend. In the case of a diamond top, the pattern forms after a sustained uptrend, and the breakout tends to occur below the lower support line, pointing to a bearish reversal. This means that selling pressure has overtaken buying interest, and prices are likely to decline. For a diamond bottom, which appears after a prolonged downtrend, the breakout usually happens above the upper resistance line, suggesting the emergence of bullish momentum and the potential for prices to rise.
The breakout itself is often sudden and accompanied by a surge in trading volume, as market participants recognize the pattern's completion and act quickly on the anticipated move. This decisive push can trigger strong follow-through in the breakout direction, making the diamond chart pattern a useful tool for spotting key turning points in the market.
🔗 When
When Is a Diamond Top Chart Pattern Formed?
A diamond top chart pattern typically appears near the end of a strong upward trend, acting as a signal that the prevailing bullish momentum may be coming to an end. It forms when market dynamics shift, creating a period of instability and transition before a potential reversal to the downside.
The pattern unfolds in several distinct stages. It begins with a sustained uptrend, where buyers are firmly in control and pushing prices higher over time. During this phase, optimism is high, and the market is generally moving with clear direction.
As the trend progresses, volatility increases. Price movements become more erratic, with larger swings in both directions. These fluctuations create a series of higher highs and lower lows, reflecting growing tension between buyers and sellers. The previously steady uptrend becomes less predictable, hinting that confidence in further upward movement is weakening.
Following this increase in volatility, the market begins to consolidate. The wide range of price action starts to compress, and the highs become progressively lower while the lows become higher. This stage marks a shift toward indecision, where neither side is able to dominate the market. The result is a tightening price structure that leads to the formation of the upper half of the diamond shape.
Eventually, the pattern reaches its final and most critical stage: the breakout. This occurs when the price breaks below the lower boundary of the pattern—typically a trendline connecting the series of higher lows. This move is often sharp and may be accompanied by increased trading volume, suggesting that selling pressure is accelerating and a new downward trend could be underway.
The appearance of a diamond top indicates that buying interest is fading. Traders may interpret this as a warning that the market is about to reverse course. As sellers begin to outweigh buyers, the potential for a price decline becomes increasingly likely. This is why many traders view the diamond top as a reliable reversal pattern when it appears after a well-defined uptrend.
🔗 Indicate
What Does a Diamond Chart Pattern Indicate?
The diamond chart pattern is a reversal pattern that signals a potential change in the prevailing trend:
- Diamond Top: Occurs after an uptrend and indicates a potential reversal to a downtrend.
- Diamond Bottom: Forms after a downtrend and suggests a possible shift to an uptrend.
Traders interpret the breakout direction as a signal to enter trades aligned with the new trend. The pattern's reliability increases when confirmed by volume spikes and other technical indicators.
🔗 Trade
How to Trade When You See a Diamond Chart Pattern
Trading the diamond chart pattern successfully requires more than simply spotting the shape on a chart. It involves a careful, step-by-step process that includes identifying the formation accurately, confirming the breakout direction, and applying effective trade management techniques. Because the pattern often signals a reversal, it can offer valuable entry points—provided it is interpreted correctly and supported by additional technical factors.
Identify the Pattern
The first and most important step is identifying the diamond pattern in real-time. The structure begins with a broadening price range, where both higher highs and lower lows are visible. This is followed by a narrowing of that range, forming lower highs and higher lows. When connected by trendlines, these movements should resemble a diamond shape. It’s essential to identify this formation within the context of a preceding trend—a strong uptrend for a diamond top or a prolonged downtrend for a diamond bottom. The pattern is not valid in sideways or choppy markets.
Traders should also be cautious not to confuse this structure with similar patterns like triangles or head and shoulders. Taking the time to mark out the formation clearly on your chart helps prevent misinterpretation.
Confirm the Breakout
Once the pattern appears to be complete, the next step is to wait for a breakout. This is the most critical part of the process, as the breakout direction determines the potential trade. A move above the upper boundary of the diamond suggests that buyers are regaining control and a bullish trend could follow. Conversely, a drop below the lower boundary typically indicates that selling pressure has overtaken buying interest, setting the stage for a bearish move.
Volume can offer useful clues here. A significant increase in trading volume at the moment of breakout often supports the legitimacy of the move. If the price breaks out on low volume, the signal may be less reliable and could result in a false move or retracement.
To avoid jumping in too early, many traders wait for a confirmation candle—typically a strong close outside the pattern in the breakout direction.
Enter the Trade
Once the breakout is confirmed, the entry strategy depends on the direction:
- Bullish Breakout: Enter a long position shortly after the price moves above the upper resistance line of the diamond pattern. This trade anticipates continued upward momentum following the breakout.
- Bearish Breakout: Enter a short position once the price breaks below the lower support line. This suggests that downward pressure is gaining strength, and the asset may move into a new downtrend.
In both cases, it's important not to act impulsively on the first sign of a breakout. Waiting for a candle to close outside the pattern—or even a small retest of the broken level—can help filter out false signals.
Set Stop-Loss Orders
Managing risk is a fundamental part of trading any pattern. For diamond chart patterns, stop-loss placement should reflect the size and structure of the formation:
- In a long trade, a stop-loss can be placed just below the most recent swing low or below the lower edge of the diamond.
- In a short trade, a stop-loss may be set just above the most recent swing high or above the upper edge of the diamond.
This placement helps protect against unexpected reversals or failed breakouts.
Determine Profit Targets
To calculate potential profits, many traders measure the height of the diamond pattern—from the highest high to the lowest low—and project this distance from the breakout point in the direction of the trade. This gives a reasonable estimate of how far the price may travel following the breakout.
Some traders also set multiple profit targets, closing part of the position at the first target and leaving the rest to run if momentum continues. This strategy allows for flexibility and reduces the psychological pressure of managing an open position.
Example Table: Entry and Exit Strategy Summary
Trade Direction | Entry Trigger | Stop-Loss Placement | Target Estimation |
Long | Break above upper line | Below recent swing low | Height of pattern added to breakout |
Short | Break below lower line | Above recent swing high | Height of pattern subtracted |
By following these steps—recognizing the pattern, confirming the breakout, and managing the trade with clear rules—traders can use the diamond chart pattern as a reliable tool for identifying and acting on potential reversals in price trends.
🔗 Key
Key Characteristics of the Diamond Chart Pattern
The diamond chart pattern is distinguished by several defining features that aid traders in its identification and interpretation:
- Formation Phases: The pattern initiates with a broadening phase, characterized by higher highs and lower lows, followed by a narrowing phase with lower highs and higher lows, culminating in a diamond shape.
- Volume Dynamics: Typically, trading volume decreases during the formation of the pattern, reflecting market indecision, and then surges upon breakout, indicating renewed momentum.
- Trend Reversal Indicator: The diamond pattern often signals a reversal of the prevailing trend, making it a valuable tool for anticipating market shifts.
- Symmetry: The pattern exhibits a symmetrical structure, with the price action forming a shape that resembles a diamond on the chart.
- Duration: The formation of the diamond pattern can span several weeks to months, depending on the time frame of the chart.
Understanding these characteristics is crucial for traders aiming to leverage the diamond chart pattern in their technical analysis.
🔗 Tools
Tools and Resources for Confirming the Diamond Pattern
Accurate identification and confirmation of the diamond chart pattern can be enhanced by utilizing various tools and resources:
- Trendlines: Drawing trendlines along the highs and lows of the price action helps in visualizing the diamond shape and identifying potential breakout points.
- Volume Indicators: Monitoring trading volume is essential, as a significant increase in volume during the breakout phase adds credibility to the pattern.
- Technical Indicators: Incorporating indicators such as the Relative Strength Index (RSI) or Moving Average Convergence Divergence (MACD) can provide additional confirmation of the pattern and the strength of the breakout.
- Charting Software: Utilizing advanced charting platforms that offer customizable tools and indicators can facilitate the identification and analysis of the diamond pattern.
- Educational Resources: Engaging with educational materials, such as articles, tutorials, and webinars, can deepen understanding and improve pattern recognition skills.
By integrating these tools and resources, traders can enhance their ability to accurately identify and effectively trade the diamond chart pattern.
🔗 Significance
Significance of the Diamond Chart Pattern in Technical Analysis
The diamond chart pattern holds considerable significance in technical analysis due to its implications for market behavior:
- Trend Reversal Signal: The pattern serves as an indicator of potential trend reversals, allowing traders to anticipate changes in market direction and adjust their strategies accordingly.
- Market Psychology Insight: The formation reflects a period of indecision and consolidation, providing insights into the underlying market psychology and the balance between supply and demand.
- Risk Management: Identifying the diamond pattern enables traders to implement risk management strategies, such as setting stop-loss orders and determining profit targets based on the pattern's structure.
- Strategic Planning: The pattern's predictive nature assists traders in strategic planning, allowing for timely entry and exit points in alignment with anticipated market movements.
Incorporating the diamond chart pattern into technical analysis empowers traders with a robust tool for navigating market dynamics and making informed trading decisions.

🔗 Reliable
How Reliable Is the Diamond Chart Pattern as a Trading Indicator?
The diamond chart pattern is a complex formation that carries unique visual and structural features, making it one of the more distinctive tools in technical analysis. Understanding these characteristics is essential for traders who wish to recognize the pattern correctly and use it effectively in their strategies.
One of the defining aspects of the diamond pattern is its symmetry. The formation typically begins with a widening of price movements—marked by higher highs and lower lows—which creates the illusion of a broadening structure on the left side of the diamond. This phase reflects a market environment with heightened volatility and an unclear directional bias, often due to an internal struggle between buyers and sellers.
As the pattern evolves, the price movements start to contract. This phase is characterized by lower highs and higher lows, suggesting a narrowing of the trading range. The right side of the pattern begins to take shape as the volatility subsides and the market moves into a phase of consolidation. The full structure, when outlined by trendlines connecting the respective highs and lows, resembles a diamond shape—hence the name.
Another important characteristic is the position of the pattern relative to the prevailing trend. The diamond top forms after an extended bullish trend, serving as a potential reversal signal indicating that buying momentum is weakening. On the other hand, the diamond bottom occurs after a bearish trend and suggests that selling pressure is fading.
Volume also plays a notable role in confirming the pattern. Typically, the volume is high during the initial expansion phase, gradually diminishes during the contraction, and then spikes again during the breakout. This fluctuation in volume aligns with the changing sentiment in the market and can offer additional clues about the strength of the potential reversal.
In terms of duration, the diamond chart pattern can take weeks or even months to fully develop, depending on the timeframe of the chart. It tends to be more reliable when observed over longer periods, where market noise is reduced and structural patterns are more clearly defined.
In summary, the diamond chart pattern is characterized by:
- A preceding clear trend (uptrend for tops, downtrend for bottoms)
- An initial broadening of price action followed by symmetrical contraction
- A diamond-shaped structure formed by converging trendlines
- A decline in volume during the formation and an increase upon breakout
- Its role as a reversal indicator rather than a continuation pattern
🔗 Limitations
Limitations of the Diamond Formation
Despite its potential, the diamond chart pattern has inherent limitations:
- Complex Identification: The pattern's formation can be intricate, leading to misidentification or confusion with similar patterns like head and shoulders.
- False Breakouts: Not all breakouts from the diamond pattern lead to sustained trends; some may result in false signals.
- Subjectivity: Drawing the trendlines to form the diamond shape can be subjective, leading to inconsistencies among traders.
- Market Conditions: The pattern may not perform well in volatile or news-driven markets where price movements are erratic.
How Reliable Is the Diamond Chart Pattern as a Trading Indicator?
The diamond chart pattern is recognized as a reversal indicator, signaling potential trend changes in financial markets. Its reliability, however, is influenced by several factors:
- Pattern Rarity: Diamond patterns are relatively uncommon, making them less frequently observed compared to other chart patterns.
- Confirmation with Volume: A breakout accompanied by significant volume increases the pattern's reliability.
- Timeframe Consideration: Diamond patterns identified on longer timeframes tend to be more reliable than those on shorter timeframes.
- Use of Additional Indicators: Incorporating other technical indicators, such as moving averages or RSI, can enhance the pattern's predictive power.
While the diamond chart pattern can provide valuable insights, traders should use it in conjunction with other analytical tools and not rely on it in isolation.
Limitations of the Diamond Formation
Despite its potential, the diamond chart pattern has inherent limitations:
- Complex Identification: The pattern's formation can be intricate, leading to misidentification or confusion with similar patterns like head and shoulders.
- False Breakouts: Not all breakouts from the diamond pattern lead to sustained trends; some may result in false signals.
- Subjectivity: Drawing the trendlines to form the diamond shape can be subjective, leading to inconsistencies among traders.
- Market Conditions: The pattern may not perform well in volatile or news-driven markets where price movements are erratic.
Understanding these limitations is crucial for traders to manage expectations and implement appropriate risk management strategies.
🔗 Risks
Potential Risks of Using Diamond Chart Patterns for Trading Decisions
Employing the diamond chart pattern in trading strategies carries certain risks:
- False Signals: The pattern may produce false breakouts, leading to potential losses if trades are entered prematurely.
- Overreliance: Depending solely on the diamond pattern without considering other market factors can result in misguided decisions.
- Delayed Recognition: Late identification of the pattern may cause traders to miss optimal entry points.
- Inadequate Risk Management: Failing to set appropriate stop-loss orders can exacerbate losses if the market moves against the trade.
To mitigate these risks, traders should combine the diamond pattern analysis with other technical indicators, maintain disciplined risk management practices, and stay informed about broader market conditions.
🔗 Mistakes
Common Mistakes Traders Make When Interpreting the Diamond Chart Pattern
Traders may encounter several pitfalls when analyzing the diamond chart pattern:
- Misidentification: Confusing the diamond pattern with other formations like head and shoulders can lead to incorrect trading decisions.
- Premature Entry: Entering a trade before the breakout is confirmed increases the risk of acting on a false signal.
- Neglecting Volume Analysis: Ignoring volume trends may result in misjudging the strength of a breakout.
- Lack of Confirmation: Failing to corroborate the pattern with additional technical indicators can reduce the reliability of the trade setup.
- Inadequate Risk Controls: Not implementing stop-loss orders or proper position sizing can lead to significant losses.
By being aware of these common mistakes, traders can enhance their analysis and execution when utilizing the diamond chart pattern.
🔗 FAQ
FAQ
Q: What is a diamond chart pattern?
A diamond chart pattern is a technical analysis formation that resembles a diamond shape on the price chart, indicating potential trend reversals.
Q: How can I identify a diamond chart pattern?
Look for a broadening formation followed by a symmetrical narrowing in price movements, forming a diamond shape, typically after a significant trend.
Q: Is the diamond chart pattern reliable?
While it can signal trend reversals, its reliability improves when confirmed with volume analysis and other technical indicators.
Q: Can the diamond pattern appear in any market?
Yes, the diamond pattern can occur in various markets, including stocks, forex, commodities, and cryptocurrencies.
Q: What are the risks of trading based on the diamond pattern?
Risks include false breakouts, misidentification, and overreliance on the pattern without additional confirmation.
Q: How should I manage risk when trading the diamond pattern?
Implement stop-loss orders, use proper position sizing, and confirm the pattern with other indicators to manage risk effectively.
Quay lại Quay lại
