What is a bull trap in trading?
Short answer: A bull trap is a false bullish signal in which price rises, often above resistance, attracting buyers before reversing lower. Traders look for warning signs such as a return below the breakout level, weak follow-through and an unsuccessful attempt to recover above resistance.
What is a bull trap, and why can a rising price become a losing trade? A bull trap is a failed upward move that attracts buyers before price reverses lower. It often develops when a market breaks above resistance but cannot sustain the breakout, leaving new buyers exposed to losses.
Five key takeaways:
- A move above resistance is a potential breakout, not proof that an uptrend will continue.
- A return below the breakout level and a failed recovery can help identify a trap.
- Volume and momentum provide supporting evidence, but neither guarantees an outcome.
- Trading a failed breakout requires a defined entry, exit and position size.
- Bull traps have no fixed duration: their development depends on the chart timeframe and market conditions.
What Is a Bull Trap in Trading?
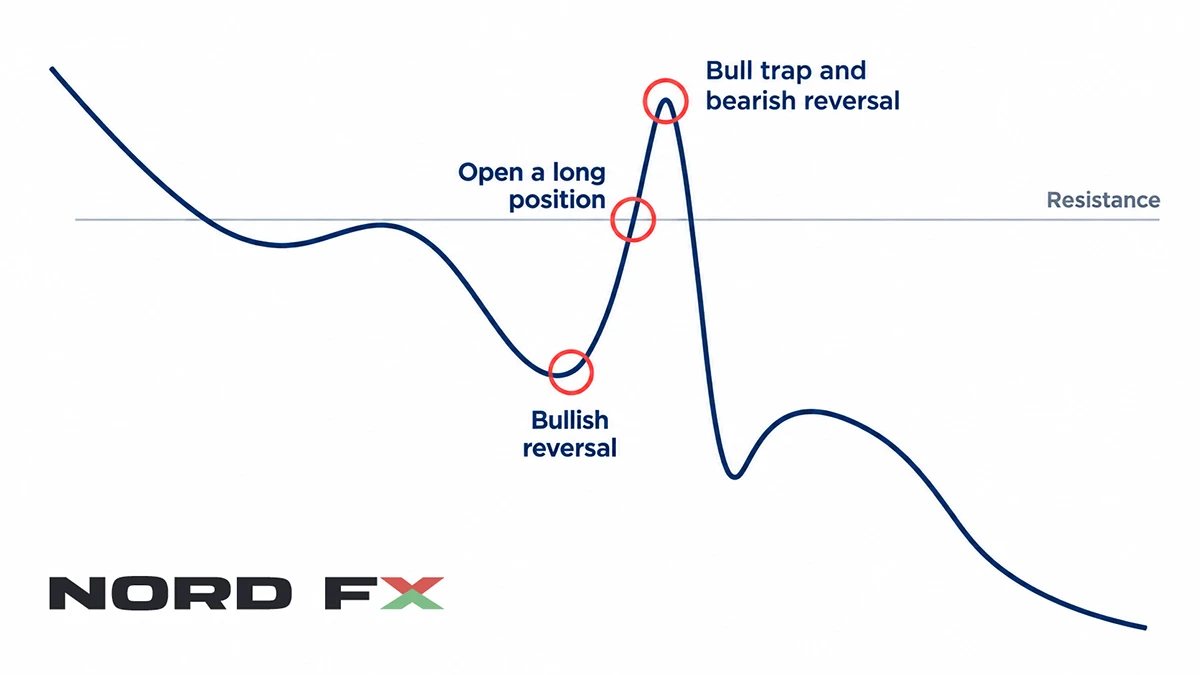
A bull trap is a misleading bullish move that reverses and catches traders who bought expecting further gains. It can appear during a recovery within a downtrend or when an apparent upward breakout fails.
Resistance is a price area where previous advances have struggled. When price crosses that area, traders may interpret the move as evidence that buyers have gained control. Some open long positions, while existing short sellers may buy to close their trades.
However, this initial buying does not guarantee sustained demand. If sellers absorb it and price retreats, the breakout can fail. Buyers exiting losing positions may then add to the selling pressure.
The term describes the outcome, not necessarily deliberate manipulation. A chart alone cannot establish who caused the reversal or why.
The price logic behind the pattern
The central question is whether trading can remain above the former resistance area. A brief move through a level shows that price reached it; continued trading above it provides stronger evidence that buyers can defend higher prices.
A bull trap develops when that apparent strength breaks down.
How to spot a bull trap?
Look for an upward breakout that loses momentum, returns below resistance and struggles to recover. Several signals together provide more useful context than a single candle or indicator.
Start with the price structure
Mark a resistance zone before the breakout happens. Previous swing highs or the upper boundary of a trading range can provide reference points. Treat resistance as an area, since prices rarely turn at exactly the same number every time.
A candle with a long upper wick shows that price retreated from its high. That is a warning, but it does not establish a trap by itself. A close back inside the previous range, followed by an unsuccessful attempt to reclaim resistance, offers stronger evidence.
Check volume and momentum
Where meaningful volume data is available, compare breakout activity with recent trading. Weak participation can raise doubts about a move, while stronger volume can support it. Neither condition makes the outcome certain.
Spot forex volume needs extra care: a platform’s tick volume reflects activity in its feed rather than total market-wide traded volume.
Momentum indicators can add context. For example, price making a higher high while the Relative Strength Index makes a lower high suggests weakening momentum. However, divergence can persist while prices continue rising.
Finally, check the broader chart. A small breakout directly beneath a major resistance area may have limited room to develop.
How to trade a bull trap?
Trading a bull trap generally means responding to a failed upward breakout, sometimes through a short position. For a trader already holding a long position, the immediate decision is whether the original reason for buying still holds.

Define the entry and invalidation
One possible approach is to wait for a close below resistance, then watch whether a recovery attempt fails near that level. A trader might consider entering short after that rejection.
Waiting can provide additional evidence, but it has a cost: the market may fall without retesting, or the eventual entry may be less attractive.
The invalidation point is where the trading idea stops making sense. For a short trade, that might be above the failed breakout high, with room for normal price fluctuations. Placing a stop extremely close just to increase position size can make ordinary volatility enough to trigger an exit.
Evaluate the target and trading costs
A previous swing low or established support zone can provide a potential target. Compare the distance to that target with the distance to the stop before entering.
Include the spread, commission and possible overnight financing. A small expected move may leave little potential reward after costs. Slippage can also increase losses, and an ordinary stop-loss order does not guarantee execution at its specified price.
Position size should reflect the planned loss at the stop. Margin is the amount required to open a leveraged position; it is not the maximum amount that can be lost.
Decide whether the setup fits
This approach may suit traders who can monitor their chosen timeframe and follow predefined exits. It is less suitable when resistance is unclear, trading costs are high relative to the target, or the downward move has already reached nearby support.
Recognising a trap does not create an obligation to trade it.
How to avoid a bull trap?
You cannot eliminate false breakouts, but you can reduce impulsive entries and control the damage when a trade fails.
Consider waiting for a candle to close above resistance rather than buying immediately when price crosses it. Another option is to wait for a pullback and assess whether former resistance holds as support.
These filters involve trade-offs. Waiting may keep you out of some failed moves, but it can also mean missing successful breakouts or entering at a higher price.
Before buying, decide what would invalidate the setup. A return into the old range might matter more than a small fluctuation above the breakout level. Make that distinction before an open position introduces emotional pressure.
Check scheduled announcements relevant to the asset. A sudden repricing can overwhelm a technical setup and make execution less predictable.
If the breakout fails, follow the exit plan. Increasing exposure simply because the market now offers a lower price changes the risk without necessarily improving the original idea.
How long does a bull trap last?
A bull trap has no fixed duration. The initial breakout and reversal may unfold within minutes on an intraday chart or across several sessions on a daily chart.
Separate the time spent above resistance from the decline that follows. A breakout might fail within one candle, while the resulting downward movement continues much longer.
Timeframe also changes interpretation. A move that traps buyers on a five-minute chart may look like a minor fluctuation within a daily uptrend.
Assess the pattern on the timeframe used for the trade, while checking broader market structure. A rule such as “all bull traps end within three candles” has no universal basis. The more useful question is whether price has confirmed or invalidated the setup.
Advantages and Disadvantages of a Bull Trap in Trading
A bull trap is not an advantage for the buyer caught in it. The potential benefits come from recognising failed breakouts and using that information to improve decisions.
Aspect | Potential advantage of recognising the pattern | Disadvantage or limitation |
Entry decisions | May discourage chasing an unsupported breakout | Waiting can mean missing a genuine advance |
Risk planning | The breakout high can provide an invalidation reference | A wide stop may make the trade unattractive |
Short opportunities | A failed recovery can provide a structured setup | Price may recover and resume rising |
Market context | Highlights difficulty sustaining higher prices | Does not establish how far a decline will travel |
Execution | Offers observable levels for planning | Fast reversals can increase slippage and costs |
The main practical limitation is uncertainty. What initially looks like a failed breakout may become a temporary interruption before another advance.
Evaluate a strategy through clearly defined rules and a meaningful sample of trades. A few convincing chart examples do not establish a dependable edge.
What is a bear trap vs bull trap?
A bull trap catches buyers after an upward move fails. A bear trap catches sellers after a downward move fails.
Feature | Bull trap | Bear trap |
Initial signal | Apparent upward breakout or bullish reversal | Apparent downward breakdown or bearish reversal |
Typical reference level | Resistance | Support |
Subsequent movement | Price reverses lower | Price reverses higher |
Traders caught | Buyers expecting further gains | Sellers expecting further declines |
Possible confirmation | Return below resistance and failed recovery | Return above support and successful hold |
Both are forms of failed directional moves. Traders anticipating continuation can find themselves positioned against the reversal.
Neither pattern proves that a lasting trend change has started. A market can move through several false signals while remaining inside a broader range.
FAQ
Is a bull trap bullish or bearish?
A bull trap begins with an apparently bullish signal, but its failure is bearish for the affected setup. That does not automatically make the longer-term outlook bearish. The significance depends on the timeframe and surrounding price structure.
What is the difference between a bull trap and a pullback?
A pullback is a temporary decline that may occur within a continuing advance. After a genuine breakout, price can revisit the breakout area and then rise again. A sustained return below that area provides stronger evidence of failure, although the distinction may only become clear later.
Which indicator is best for detecting a bull trap?
No indicator reliably identifies every bull trap. Price behaviour around resistance is the starting point, with volume and momentum providing additional context. Combining indicators does not remove uncertainty, particularly when they measure similar information.
Can bull traps happen in forex and cryptocurrency markets?
Yes, failed upward breakouts can occur in both markets. The interpretation should account for differences in liquidity, trading hours and available volume data. A signal on one venue or price feed may need additional context.
Does “brazen bull trap” mean a trading pattern?
“Brazen bull trap” is not a standard technical-analysis term. For trading research, the relevant terms are “bull trap,” “failed breakout” and “false bullish breakout.” Treating the longer phrase as a separate trading strategy would be misleading.
Can you identify a bull trap before the reversal?
You can identify warning signs, but you cannot know in advance that a breakout will fail. Weak momentum or limited follow-through may justify caution without proving a reversal is imminent. A practical plan defines how to respond to either outcome.
By John Gordon, Market Analyst at NordFX
العودة العودة