The Guide to Selecting the Best Time Frame for Intraday Trading

Intraday trading, a strategy where stocks are bought and sold within the same trading day, demands precise timing and a deep understanding of market movements. Identifying the best time frame for intraday trading can significantly impact the success of trades. This article delves into the intricacies of intraday time analysis, exploring the optimum periods for trading and the various chart time frames available to traders.

Key Takeaways

  • The best time frame for intraday trading depends on market volatility and individual trading strategies.
  • Professional traders often favor the first half of the trading day for its higher volatility.
  • Trading during the opening 15 minutes can offer lucrative opportunities but comes with higher risk.
  • Understanding the types of intraday trading charts is crucial for making informed decisions.
  • Emotion management and swift decision-making are vital skills for successful intraday trading.


Table of Contents


The Best Time Frame for Intraday Traders

In the realm of intraday trading in Forex, discerning the optimal time frame is pivotal for maximizing profitability and minimizing risks. Novice traders are particularly well-suited to trade between 10:15 am and 2:30 pm, a window that offers a balance between the volatility of the market's opening and the steadier movements that precede the closing bell. The period just after the market opens, from 10:00 am to 10:15 am, is characterized by a decrease in the initial morning volatility, providing a prime opportunity for beginners to capitalize on early market movements without the heightened risk present in the first few minutes after the market opens.

When it comes to selecting a chart time frame for intraday trading, traders are presented with a variety of options, including 1-minute, 5-minute, 15-minute, 30-minute, and 60-minute charts. This choice is deeply individual, hinging on the trader's strategy, risk tolerance, and the specific characteristics of the currency pairs they are trading. Liquidity and volume play crucial roles in determining the suitability of each time frame. For instance, shorter time frames like the 1-minute or 5-minute charts may be preferable for traders looking for quick, small gains and who can dedicate the time to closely monitor market movements. Conversely, longer time frames may offer a clearer view of the market trend, suitable for strategies that seek to capture larger price movements.

The decision to trade in the first or second half of the trading day is another consideration that intraday traders must make. The first half of the day typically witnesses higher volatility and larger price swings, which can present numerous trading opportunities but also entail greater risk. In contrast, the second half of the day might offer more predictable trends as the market begins to settle, although opportunities for significant gains may be reduced. The early morning hours, right after the market opens, are often marked by significant movements, making it a potentially lucrative but risky time for intraday trading.

Trading in the first fifteen minutes after the market opens is a double-edged sword. On one hand, this window can offer the chance for quick profits through breakout strategies as the market reacts to overnight news and early trades set the tone for the day. On the other hand, the risk of sudden and sharp price movements is elevated, requiring traders to exercise caution, utilize wider stop-losses initially, and avoid making hasty decisions based on incomplete patterns.

The consensus among experts leans towards the avoidance of trading in the very beginning and the final hour of the trading session, due to the unpredictable volatility driven by overnight news, economic data releases, and the rush of traders closing their positions. The ideal strategy, therefore, involves entering the market after the initial turmoil has subsided post-10 am, and planning to exit or square off trades by 2:30 pm, thereby sidestepping the potential pitfalls of late-day trading while capitalizing on the more stable trading conditions of the midday session. This approach allows traders to navigate the intricacies of Forex intraday trading with a measured and informed strategy, enhancing their chances of success in the fast-paced world of currency trading.

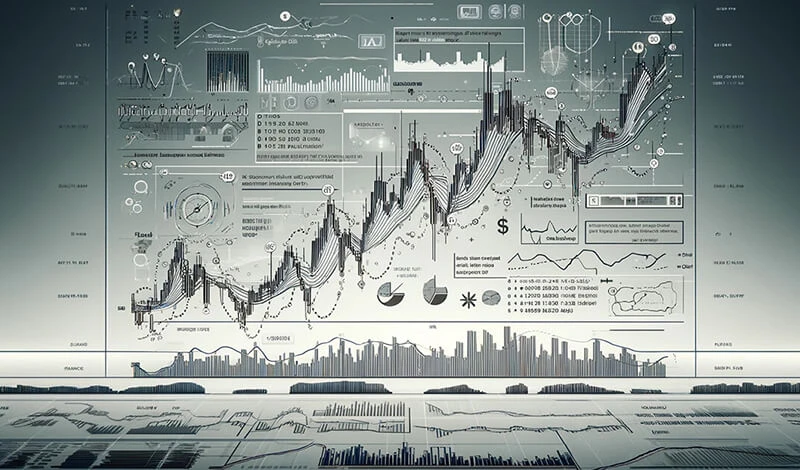
An infographic highlighting the best time frames for intraday Forex trading to capitalize on market trends.


Should You Trade in the First 15 Minutes?

Engaging in trading within the first 15 minutes of the market opening can seem attractive because of the quick price changes and the chance to leverage the initial trends of the market. Nonetheless, it's important to recognize that this time frame carries a higher level of risk and might not be appropriate for all traders. Here are some key points to think about before deciding to trade early in the session:

  • High Volatility: Early in the trading day, markets can show more volatility due to reactions to overnight news, economic updates, or company announcements. While this volatility can create opportunities, it also brings the danger of rapid and unexpected price shifts.
  • Uncertain Market Direction: In the initial 15 minutes, markets often do not have a clear trend as traders are just starting to react to news and make their first moves. This can lead to erratic and unpredictable price changes, complicating efforts to identify solid trends.
  • Reduced Liquidity: Liquidity is generally lower at the start of the trading day, which can result in bigger differences between buying and selling prices and make it harder to execute trades at the prices you want. This can affect the cost of trades and their potential success.
  • Misleading Signals: The heightened volatility and reduced liquidity early on can result in more misleading signals and market "noise." This might cause traders to make quick, poorly thought-out decisions.
  • Imbalance in Market Orders: Right as the market opens, there can be a significant imbalance due to a high volume of buy or sell orders being processed at once. This imbalance can lead to abrupt price movements that do not always align with the market's fundamental values.

Which Time Frame is for Intraday Trading?

Intraday trading requires a careful selection of time frames to match trading strategies, execution speed, and risk management. Here's how different charts serve various intraday trading approaches:

  • 1-Minute Chart: Ideal for ultra-short-term strategies such as scalping and spotting opening range breakouts. This chart demands swift trade execution and continuous market monitoring, making it suitable for traders who can dedicate full attention to the markets.
  • 5-Minute Chart: This time frame is favored for short-term momentum trading, pinpointing support and resistance levels, and identifying intraday trends. It provides more context than the 1-minute chart, offering a balance between detail and overview.
  • 15-Minute Chart: A preferred choice for many intraday traders, the 15-minute chart strikes a balance between capturing short-term movements and filtering out market "noise". It's effective for clearly identifying key support/resistance points and trend signals, making it a versatile tool for various trading strategies.
  • 30-Minute Chart: Geared towards traders with a swing trading approach within the day, the 30-minute chart reduces the noise found in shorter time frames. It highlights significant intraday support and resistance levels, offering a clearer view of the market's broader context.
  • 60-Minute Chart: This chart is utilized for identifying longer-term intraday trends and major support/resistance zones for the day. It's suitable for traders looking to make fewer, more considered trades based on the overall direction of the market rather than quick movements.

While 15-minute and 5-minute charts are among the most commonly used by intraday traders for their balance of detail and overview, the choice of time frame ultimately depends on the stock's volume, liquidity, and the trader's specific needs and strategies. Each chart serves distinct purposes, from executing rapid scalping strategies to making informed decisions based on the broader movements of the day.

Choosing the Intraday Trading Chart Time Frame

Choosing the right intraday trading chart time frame is an intricate process that hinges on a trader's strategy, experience level, and the specific characteristics of the markets they are trading in. Each time frame offers a unique perspective on the market's movements and can signal different entry and exit points. For example, a 1-minute chart provides a detailed view of price action and is favored by traders looking for quick, small gains. However, it also requires the ability to make rapid decisions and can lead to overtrading if not managed carefully. On the other hand, a 15-minute to 1-hour chart might be more suitable for traders seeking to capture larger market moves and who prefer a more analytical approach, allowing time to assess market trends and momentum before making a trade. The choice of time frame should align with the trader's ability to monitor the markets continuously and their capacity to process information and act quickly.

A detailed comparison of various chart time frames and their suitability for different trading strategies.

Furthermore, the selection of a chart time frame is not just about personal preference but also about optimizing the effectiveness of the trading strategy being used. Different trading strategies, such as scalping, day trading, and swing trading, have varying requirements for the frequency and speed of trading opportunities they exploit. Scalping strategies, which rely on making numerous trades for small profits, often use shorter time frames to identify quick entry and exit points. In contrast, strategies that aim for larger profits per trade might use longer time frames to identify and follow more significant trend movements. Traders often experiment with multiple time frames to identify which one offers the best signals for their specific trading approach, sometimes combining insights from several time frames to enhance decision-making.

Additionally, the choice of time frame can significantly impact a trader's psychological and emotional well-being. Trading on very short time frames can be stressful and exhausting, requiring constant attention and quick reflexes. It can lead to burnout and affect decision-making quality over time. In contrast, longer time frames, while potentially offering fewer trading opportunities, can allow for a more relaxed trading pace, giving traders more time to analyze the market and plan their trades. The key is to find a balance that not only matches the trader's strategy and goals but also their personal temperament and lifestyle. This balance ensures that trading remains sustainable and enjoyable over the long term, contributing to overall success in the markets.

Benefits of Trading at the Optimum Time Frame

Trading at the optimum time frame aligns a trader's strategy with market dynamics, maximizing efficiency and effectiveness. Here are seven key benefits of selecting and trading within the best time frame for intraday trading:

  1. Increased Opportunities for Profit: A well-chosen time frame captures higher market volatility, offering more opportunities for profitable trades. This volatility is often linked to market openings, closings, and economic announcements, where price movements are more pronounced.
  2. Enhanced Risk Management: Trading in the optimum time frame allows traders to make more informed decisions with a comprehensive view of market trends. This visibility helps in implementing precise stop-loss orders and managing position sizes effectively, thus protecting against significant losses.
  3. Improved Precision in Entry and Exit Points: Identifying the right time frame enhances the accuracy of entry and exit points, minimizing the risk of premature or late trades. This precision stems from a better understanding of short-term market fluctuations and trend reversals.
  4. Greater Efficiency in Trading: By focusing on a time frame that suits their trading style, traders can filter out 'market noise' or irrelevant price movements. This focus increases the efficiency of their trading strategy, allowing them to concentrate on signals that align with their market analysis and trading goals.
  5. Optimized Psychological Comfort: Trading within a comfortable time frame reduces stress and anxiety, contributing to clearer decision-making. A time frame that matches a trader's pace allows for a more deliberate analysis and execution of trades, avoiding the pressure of rushed decisions.
  6. Adaptability to Market Conditions: The optimum time frame enables traders to adapt more fluidly to changing market conditions. By understanding the nuances of different time frames, traders can switch strategies to capitalize on unexpected market movements or periods of high volatility.
  7. Capability to Leverage Market Rhythms: Each market session has its unique characteristics and trading volumes, and the right time frame can help traders exploit these rhythms. For instance, trading at the opening might offer quick profits from overnight news, while the closing hours might present opportunities tied to end-of-day positioning.


Types of Intraday Trading Charts

Intraday traders use various chart types to analyze market movements, including:

  1. Line Charts: The simplest form of trading charts, line charts, draw a single line from one closing price to the next. They provide a clear, straightforward visualization of the price movement over a specified period. Line charts are particularly useful for identifying overall trends and closing price data over time but lack the detail provided by other chart types.
  2. Bar Charts (OHLC Charts): Bar charts offer more information than line charts by displaying the opening (O), high (H), low (L), and closing (C) prices for each selected time period. Each bar represents the price range of a particular timeframe, with a horizontal notch on the side of the bar indicating the closing price. Bar charts are valuable for traders looking to understand the volatility and price range within specific intervals.
  3. Candlestick Charts: Originating from Japan, candlestick charts have become extremely popular among intraday traders due to the wealth of information they provide. Each "candlestick" shows the open, high, low, and close prices, similar to bar charts. However, the body of the candlestick (the difference between the open and close) is filled, making it easier to see market movements at a glance. Candlestick patterns can indicate potential market reversals or continuations and are widely used for technical analysis.
  4. Heikin-Ashi Charts: A variation of the candlestick chart, Heikin-Ashi charts are used to filter out market noise and more clearly identify trends. They use average price data from the previous candlestick to create a smoother visual representation, which can be particularly helpful in spotting trends and reversals. However, because they are derived from average prices, they may not fully reflect the volatility of the market.
  5. Renko Charts: Unlike traditional charts that are based on time intervals, Renko charts focus solely on price movement, ignoring time and volume. A new "brick" is drawn in the chart only when the price moves by a predefined amount, which helps traders to filter out minor price changes and focus on significant trends. However, the lack of time and volume data can be a limitation for some trading strategies.

Each type offers different insights into market conditions, with candlestick charts being particularly popular for their detailed representation of price movements.

How Do Experienced Traders Choose the Time Frame?

Experienced traders select their trading time frame based on a comprehensive evaluation of their trading strategy, market conditions, and personal trading style. They understand that the choice of time frame is not just about preference but about aligning with the objectives of their trading plan. For instance, a trader focusing on scalping will lean towards using shorter time frames like the 1-minute or 5-minute charts, which are conducive to capturing small, quick profits from minor price changes. These traders are adept at making fast decisions and are comfortable with the high level of monitoring and the rapid execution required. Conversely, traders aiming for larger gains per trade, with a willingness to hold positions for several hours or the entire trading day, might opt for 30-minute or 60-minute charts. These time frames help them identify broader market trends and support or resistance levels, reducing the noise and allowing for a clearer analysis of market direction.

Moreover, experienced traders often employ a multi-time frame analysis approach to enhance their decision-making process. This involves observing the market through more than one time frame to validate trading signals. For example, a trader might use a 15-minute chart to identify the general trend and then switch to a 5-minute chart to pinpoint precise entry and exit points. This strategy enables traders to grasp the bigger picture and the minute details, ensuring their trades are both strategically sound and tactically timed. They also consider market volatility and liquidity when choosing their time frame, as these factors can significantly impact the effectiveness of their chosen strategy. By aligning their time frame with their trading strategy, market conditions, and personal preferences, experienced traders can optimize their trading performance and manage risk more effectively.

Trading at the Opening of the Market

Trading at the market opening involves navigating a period of heightened volatility and liquidity as traders and institutions react to overnight news, economic reports, and global market trends. This time is characterized by significant price movements, offering opportunities for quick gains, especially for strategies like gap trading or capturing initial momentum. However, the initial 15 to 30 minutes can be particularly challenging due to the rapid shifts in prices and the potential for "false starts" where the market appears to move in one direction before swiftly reversing. Traders specializing in the opening hours often prepare by analyzing pre-market activities and news to forecast potential movements. They also set strict risk management rules, such as tighter stop-loss orders, to protect against the unpredictability of this period. Successfully trading the market opening requires a combination of fast decision-making, thorough preparation, and an acute awareness of market sentiment and trends.

An overview of effective intraday trading strategies that focus on volatility, liquidity, and technical analysis to secure gains.


Swift Decision-Making and Emotion Management

Swift decision-making and emotion management are crucial skills in the high-stakes environment of trading, where seconds can mean the difference between profit and loss. Traders who excel in these areas often rely on a blend of rigorous preparation, clear trading strategies, and predefined risk parameters to navigate the markets effectively. By committing to a disciplined approach, they minimize the impact of emotions such as fear and greed, enabling them to make objective decisions quickly. This involves not only having the technical ability to analyze charts and indicators in real-time but also the psychological strength to adhere to stop-loss orders and take-profit levels without hesitation. Successful traders often practice techniques such as mindfulness or stress-reduction exercises to enhance their mental clarity, ensuring that even in the midst of rapid market movements, their decisions are driven by logic and strategy rather than impulse or emotional reactions.


3 Best Strategies for Intraday Trading

1. Trend Following Strategy: The trend following strategy is a cornerstone of intraday trading that capitalizes on the momentum of the market's current direction. Traders using this approach closely monitor price movements and utilize a range of technical indicators, such as moving averages, MACD (Moving Average Convergence Divergence), and RSI (Relative Strength Index), to identify the trend's strength and potential continuation points. The key to success in trend following lies in identifying clear uptrends or downtrends early and executing trades that align with this direction, ensuring traders are always 'swimming with the tide'. This strategy requires patience and discipline, as traders must resist the temptation to trade against the trend and wait for confirmation signals before entering or exiting positions. Risk management is critical, with stop-loss orders meticulously placed to protect against sudden trend reversals.

2. Scalping: Scalping is a high-frequency trading strategy designed to profit from small price changes, requiring traders to have a keen sense of market timing and quick execution. Scalpers thrive in the fast-paced environment of the trading floor, engaging in dozens, if not hundreds, of trades within a single day. They focus on liquid markets to quickly enter and exit trades, leveraging high volume to accumulate profits. Key tools for scalpers include order book analysis, tick charts, and real-time news feeds to stay ahead of minute-by-minute market changes. Scalpers often employ very tight stop-loss orders to limit potential losses on each trade. The success of scalping depends on a trader's ability to maintain focus, manage stress, and adhere to a disciplined trading plan that meticulously outlines entry, exit, and risk management criteria.

3. Breakout Trading: Breakout trading involves identifying and trading within significant price movements as they break through established support or resistance levels. This strategy is predicated on the idea that when key price barriers are breached, significant volatility and price movements are likely to follow as other traders react to the breakout. Traders utilizing this strategy often wait for confirmations of the breakout, such as an increase in trading volume, to reduce the risk of false breakouts. Technical analysis tools like volume indicators, chart patterns (e.g., triangles, flags, and wedges), and momentum oscillators can be instrumental in pinpointing potential breakout points. Once a breakout is confirmed, traders quickly take positions in the direction of the breakout, setting stop-loss orders just outside the breached levels to protect against the possibility of a reversal. Success in breakout trading requires a deep understanding of market sentiment, the ability to interpret volume and price action accurately, and the discipline to exit trades promptly if the expected momentum does not materialize.

For a more in-depth exploration of intraday trading strategies and indicators, including how moving averages, RSI, and MACD can guide your trades, NordFX offers comprehensive insights in the Learning Center

Psychological Preparation and Managing Trading Fears

Trading psychology plays a crucial role in intraday trading. Key fears such as the fear of loss, missing out, making mistakes, and facing criticism can significantly impact decision-making. Overcoming these fears involves education, developing a well-tested strategy, and adhering to strict money management principles.


FAQs on Intraday Trading

Q: Who should consider intraday trading? A: Intraday trading is best suited for individuals who can dedicate time to monitor the markets actively, possess a strong understanding of market analysis and risk management, and can make quick decisions under pressure.

Q: When is the best time to execute intraday trades? A: The opening and closing hours of the trading session, known for heightened volatility, offer the most promising opportunities for intraday traders.

Q: What are the advantages and disadvantages of intraday trading? A: Intraday trading offers the potential for quick profits and avoids overnight market risk. However, it requires significant time investment and can be stressful due to the fast-paced nature of the markets.

Q: How can traders manage the psychological pressures of intraday trading? A: Effective strategies include practicing on demo accounts to simulate trading experiences, keeping a detailed trader's diary for self-reflection, and undergoing stress tests to improve decision-making under pressure. These methods help build confidence and refine trading strategies without the financial risks associated with real trading.


Keep the Bigger Picture in Mind

While focusing on short-term movements, it's also important for traders to consider longer-term trends and how they might impact intraday trading strategies.

For further insights and strategies on intraday trading time frames, the following YouTube videos provide valuable perspectives:

The process of selecting the best time frame for intraday trading is crucial for aligning with market dynamics and individual trading objectives. Intraday trading offers a spectrum of opportunities across different times of the day, each with its unique characteristics and potential for profitability.
Go Back Go Back
This website uses cookies. Learn more about our Cookies Policy.