It is well known that trading in the financial markets is one of the most dynamic and effective ways to make a profit, even in the absence of significant initial capital. That is why it is very popular all over the world. However, it is also well known that this activity is fraught with great risks, and can lead to a complete loss of funds. To trade successfully, a trader must have a good understanding of how the market functions, what the current market situation is and what can happen in the future. Two main types of analysis are traditionally used for these purposes: technical and fundamental.
Technical Analysis
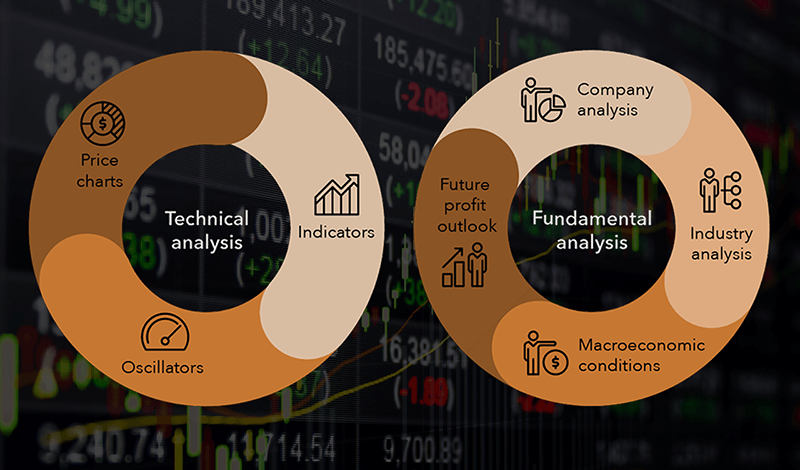
Technical analysis can be divided into graphical and computer (or indicator) ones. The first one is levels, channels, trends, various patterns. The second is indicators, the readings of which are usually calculated by a computer. They intersect in many cases, since a huge number of indicators have been created on the basis of many graphical tools in recent years. In addition, there are, for example, Elliot waves and Japanese candlesticks, which are also related to technical analysis.
Graphical Analysis. The name of this method speaks for itself, as it is based on the study of price charts. Graphical analysis includes the study of price levels and trends, as well as the identification of various patterns and formations on charts, and other visual analysis tools. In addition, Graphical analysis may include the use of various indicators such as moving averages (MAs) to help traders determine future price directions.
One of the main advantages of graphical analysis is its visualization. It can help identify various trends in the market that may not be obvious when using other methods of analysis. It would seem that charts on a computer or smartphone screen can be easily understood even by novice traders. However, it is not that simple. To use this type of analysis effectively, traders must have a sufficient level of knowledge and experience to understand how to correctly interpret charts and make appropriate decisions. And this may require time and effort to learn and acquire practical skills.
Computer (or indicator) analysis is based on the study of not only price charts, but also trading volumes. The basic assumption is that historical quotes and volumes can be used to predict future prices and trends. Various indicators are used for this, such as moving averages (MA), MACD, RSI, stochastic oscillator, Bollinger Bands and many others, helping the trader to determine the moments of entry and exit from positions.
One of the advantages of technical analysis is that it is based on data that is readily available, including in the MetaTrader-4 (MT4) trading terminal, and can be processed very quickly. Several dozens of most popular indicators are already built into this terminal. In addition, many thousands of other indicators have been developed for MT4. Some of them can be purchased, and some can be downloaded for free.
Such indicators are used to develop strategies and are used both in manual and automated trading using expert advisors. They can be effective not only for long- and medium-term trading, but also, for example, for pipsing and scalping. However, before using it in real trading, we strongly advise you to test each of them on the strategy tester that is available in the MT4 terminal, as well as evaluate its effectiveness on a demo account, which is available for NordFX clients.
Despite all its advantages, technical analysis (both graphical and indicator) is not void serious drawbacks. One of them is that it can react to false signals, especially in volatile market conditions. In addition, the indicator readings are based solely on historical quotes and are late. This applies even to the signals of the so-called leading indicators, which can predict the development of events only by looking for similar situations in the past.
Another drawback is that the indicator readings are highly dependent on their settings. With the same settings, the quality of their work can vary greatly both for different trading instruments and for different time frames. In addition, a change in the market situation can also lead to a failure in their work.
And finally, the most important, in our opinion, drawback is that technical analysis is not able to take into account fundamental factors that can affect market prices in the most unexpected way. That is why a trader can achieve maximum efficiency in their work by combining it with fundamental analysis, as well as other approaches, including risk management, portfolio diversification, etc.
Fundamental Analysis
Fundamental analysis is based on the study of economic, financial, political, and social factors that affect the price of an asset. It can help investors determine when the price of an asset is overvalued or undervalued, try to predict how the price of an asset will change in the future, and decide whether to buy or sell an asset.
Fundamental factors may include:
- Economic data: statistics on GDP, inflation, unemployment, output, trade balance, etc.
- Monetary policy and interest rates of Central Banks.
- Political and geopolitical events: elections, legislative base and its possible change.
- Revolutions, civil unrest, wars, terrorist acts, etc.
- Social trends: demographic changes, technological innovations, changing consumer demand, etc.
- Seasonality and natural disasters, shortage or excess of natural resources.
- All sorts of other factors: market trends, index changes, company news, their financial performance, etc.
So, the difference between fundamental analysis and technical analysis is as follows. Technical analysis is based on the study of charts and technical indicators, and uses historical price and volume data to predict future market movements. Fundamental analysis uses a wider set of data. It is based on the study of factors that have not only influenced the price of an asset in the past and in the present but may also affect it in the future.
One of the advantages of fundamental analysis is its ability to predict long-term trends and evaluate the fundamental value of an asset. However, it can be complex and require a lot of time and effort to collect and study all the necessary data. In addition, such analysis may not always take into account short-term market events, such as changes in investor sentiment or unexpected geopolitical events. Based on this, fundamental analysis is often used for long-term investments, while technical analysis is used for short-term transactions.
Combination of Various Types of Analysis and Statistical Models
It is important to understand that each of these methods has its advantages and disadvantages, and the best choice depends on the individual needs, strategy, degree of risk and goals of each trader. At the same time, traders often use a combination of both types of analysis. This helps to reduce risks and increase the likelihood of successful trading.
In addition, the study of a large amount of historical data and the use of statistical methods, such as regression analysis, allows you to build mathematical models to identify trends and predict future price directions, as well as to determine the optimal entry and exit points for positions. One of the advantages of such statistical models is their ability to process large amounts of data and reveal hidden trends and dependencies in the market.
However, such statistical modeling, of course, has disadvantages as well and cannot guarantee success. First, it requires significant knowledge in statistics, mathematics, and coding. Secondly, the statistical model can be subject to errors and inaccuracies, especially in complex and atypical market conditions.
How Celebrities Trade
If you delve into the biographies of the legendary traders, it becomes clear that they used different types of analysis, although each of them had their own preferences.
- Warren Buffett is known as a supporter of fundamental analysis. He bases his investment decisions on an analysis of companies' financial performance, such as earnings, dividends, assets, and debt. This allows him to determine the long-term value of the stock and its upside potential. Buffett also believes it's important to invest in companies you believe in and hold stocks for a long period of time.
- George Soros is a supporter of technical analysis. It uses price charts to determine trends and patterns in the market, and also focuses on the readings of various indicators. Soros also believes that it is important to assess the risks and reliability of your investments, and use risk management strategies, that is, money management.
- Peter Lynch is known as a fan of the combined approach, which includes both fundamental and technical analysis. He examines the financial statements of companies to assess their potential for growth and uses price charts and other indicators to make decisions about entering and exiting positions.
- John Paulson is considered adept at event analysis. He analyzes news and events such as corporate announcements, political changes and economic data to determine their impact on market prices. Paulson also uses fundamental and technical analysis to refine his investment decisions.
திரும்பிச் செல்லவும் திரும்பிச் செல்லவும்
