Support and resistance levels are among the key concepts in trading on Forex and other financial markets. They are employed in a multitude of trading strategies and serve as the basis for hundreds and thousands of indicators and advisory robots. So, what exactly are they? Let's explore the fundamental concepts and aspects of their practical application.
Key Definitions
Support and resistance levels serve as the boundaries of the price range within which an asset is traded. These boundaries can manifest as not only horizontal lines but also sloped curved lines. Upon reaching these boundaries, the asset's price often changes its trajectory.
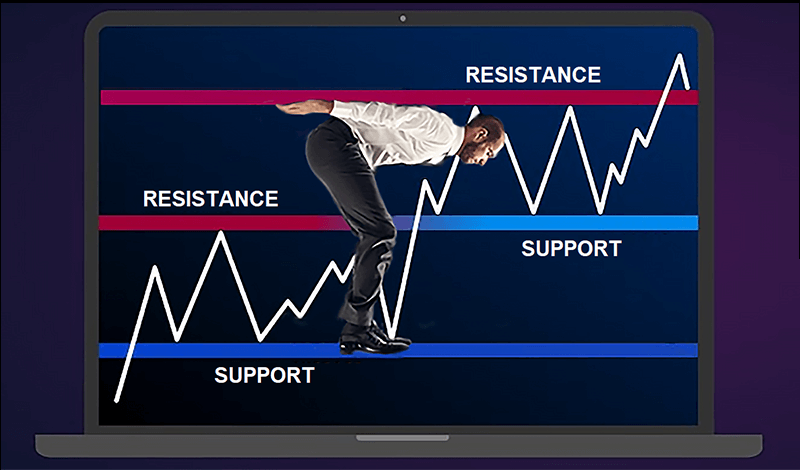
A support level is a price point where, if reached, the asset is likely to rebound upwards, as bullish buyers strive to prevent further declines. A resistance level, conversely, is a price point where bearish sellers exert control, often causing the price to reverse and move downwards.
In these definitions, we have purposefully used terms like 'often' and 'may.' This is because the price reversal at these levels is not a certainty; it may or may not happen. Instead of rebounding from a support level, the price might break through and continue to decline, or upon reaching a resistance level, it might continue its upward movement. The probability of a rebound or a breakthrough allows us to categorize levels as strong or weak. More on this will be discussed in a separate chapter later.
Differences Between Support/Resistance Zones and Levels
While support and resistance levels can be visualized as specific lines on a chart, support and resistance zones represent price ranges instead. We believe this is a more accurate concept, as prices rarely change their trajectory at a single specific point. For instance, the resistance level for the EUR/USD pair might be at the 1.1500 mark. However, the price could reverse not just at 1.1500 but also at 1.1485 (before reaching it) or at 1.1515 (a false breakout). This margin of ±15 points is what some experts, by analogy with mechanics, refer to as 'slack.'
The width of the zone (or the size of the slack) can vary depending on the specific asset (in Forex, the currency pair) and the time frame. On long-term charts, these zones can be broader, whereas on short-term charts, they are often narrower. Current volatility also affects this parameter. For example, during the release of significant economic news, high volatility frequently leads to a considerable widening of such zones. We will examine several examples to illustrate this point
– Currency Pairs: For the EUR/USD pair on a daily chart (D1), the width of the support/resistance zone can be in the range of 20-50 points. For the British pound (GBP/USD), which is often more volatile, this zone can be broader, around 30-60 points. For the USD/JPY pair, zones were previously relatively narrow, ranging between 15-40 points. However, significant divergences in the monetary policies of the U.S. Federal Reserve and the Bank of Japan post-2021 have led to a sharp increase in volatility and, consequently, an expansion of the slack for this pair.
– Time Frames: On the daily chart (D1) under standard conditions, the width of support/resistance zones usually varies from 20 to 60 points, depending on the currency pair. On hourly charts (H1), these zones can be narrower, approximately ranging from 10 to 30 points. On very short time frames (M1-M15), the zones can be even narrower, ranging from 5 to 15 points.
– Volatility: During periods of high volatility, the width of these zones may expand. For instance, during the release of economic news, the zone width for the EUR/USD pair could widen to 70-100 points or more.
It's important to note that these examples serve merely as guidelines and may vary based on market conditions. Experienced traders often adapt their strategies to account for current volatility and other factors.
How to Identify Support/Resistance Levels
Thus, it's clear from the above discussion that the concept of support/resistance is actually composed of two elements—the level itself and the zone surrounding it. Psychological levels such as 1.1000 or 1.5000 often serve as support/resistance because traders frequently place buy or sell orders near these "round" levels. Additionally, levels with high trading volumes often act as support/resistance. This occurs because a large number of traders are interested in these levels and are willing to execute their trades there.
Levels that have been tested multiple times and have "held" the price are considered more reliable. If the price has approached a specific level several times without breaking it, the likelihood increases that this level will serve as strong resistance or strong support in the future.
So, how are support and resistance levels identified in practice? The simplest way to identify these levels is through visual price chart analysis. Traders look for points where the asset price has halted and reversed direction in the past. These points become potential levels of support or resistance. Often, horizontal lines are drawn through these points to identify levels. Sometimes lines are drawn parallel to each other, forming a trading channel within which the asset price oscillates. It should be noted that a trading channel can be not only horizontal but also sloped. Moreover, the boundaries of this channel can be either straight or curved lines. To facilitate the construction of levels and channels, the MetaTrader-4 trading terminal offers various graphical tools as well as specialized indicators.
Strong and Weak Levels of Support/Resistance
What differentiates strong levels from weak ones? This question is important for any trader engaged in technical analysis, as understanding the distinctions can significantly enhance the effectiveness of their trading strategy. It helps in avoiding false signals and increases the probability of successful trades.
So, these are the factors that indicate strong levels:
– Multiple Confirmations: Strong levels are often tested multiple times. The more frequently a level holds and prevents the price from breaking through, the stronger it is considered to be.
– Trading Volume: An increase in trading volume is observed when a strong level is reached, indicating active interest in that level from a large number of traders.
– Historical Significance: Strong levels can be identified based on historical data and often coincide with psychological levels (e.g., round numbers).
– Fundamental Factors Alignment: The strength of a support or resistance level is further reinforced when it coincides with key fundamental indicators or news events.
Weak support and resistance levels typically undergo infrequent testing and generally fail to hold prices. When these levels are touched, the change in trading volume is usually insignificant. Moreover, they are often not anchored in historical data and seldom align with fundamental market indicators, making them more susceptible to market noise.
Indicators for Identifying Support and Resistance Levels
Let's enumerate just a few of the most popular indicators, whose operating principles are based on statistical analysis of past price movements to forecast future trends. For enhanced effectiveness, experienced traders often use these indicators in combination with each other or with other methods and tools of technical and fundamental analysis.
– Moving Averages (MA). This indicator aggregates price data over a specific time period and smooths it to identify the trend. If the asset's price is above the moving average, it can act as a support zone. If below, it serves as a resistance zone. For example, the 200-day moving average is often a strong support level in a bullish trend.
– Fibonacci Retracement. This indicator employs the Fibonacci mathematical sequence to create horizontal lines that serve as potential support and resistance levels. Lines are drawn through two significant points (the high and the low) on the chart at levels of 23.6%, 38.2%, 50%, 61.8%, and 100%, which act as potential support and resistance levels.
– Pivot Points (PP). The simplest method for determining the Pivot Point (PP) has been used on Wall Street for many decades. The maximum price, minimum price, and closing price for a specific period are taken and divided by 3, yielding the PP value.
– Bollinger Bands. The indicator comprises three lines: a middle line (MA) and two outer lines, calculated as standard deviations from the middle line. These outer lines serve as zones of support and resistance. When the asset price approaches the upper line, it may indicate a resistance level; conversely, approaching the lower line could signify a support level.
Strategies for Using Support/Resistance Levels
– "Buy Low, Sell High": Traders buy an asset when its price approaches the support level and sell it when the price nears the resistance level.
– «Breakout/Breakdown Trading»: his strategy involves entering a position only after the price has convincingly broken through a support or resistance level and has securely settled either below or above it, respectively.
– «Bounce Trading»: This trading approach involves entering a position when the price rebounds off a support or resistance level.
– «False Breakout Strategy»: Traders may place buy or sell orders directly at the support or resistance level, anticipating a "false breakout," meaning a price reversal.
***
In conclusion, understanding levels and zones of support and resistance, as well as the ability to accurately identify and apply them, can serve as effective tools for profit extraction. However, like any other trading methods in financial markets, they do not guarantee 100% success and require careful analysis, interaction with other tools, and prudent risk management.
Go Back Go Back
