Intraday trading is built on speed, precision, and the ability to read price behavior in real time. Unlike long-term investing, where fundamentals often dominate decision-making, intraday trading relies heavily on technical analysis—particularly chart patterns. These visual formations help traders anticipate potential price movements and structure trades within a single trading session.
In this guide, we explore the most important intraday trading chart patterns, explain how they work, and show how traders can integrate them into practical trading strategies. Whether you trade forex, stocks, indices, or cryptocurrencies, understanding these patterns can significantly improve trade timing and risk control.

What Is Intraday Trading?
Intraday trading, also known as day trading, is a trading approach where positions are opened and closed within the same trading day. The primary objective is to profit from short-term price fluctuations rather than long-term market trends.
Intraday traders typically execute multiple trades during the session, aiming to capture small but frequent price movements. Because positions are not held overnight, traders avoid exposure to after-hours news, gaps, and unexpected market events. However, this style of trading demands constant market monitoring, fast decision-making, and strict risk management.
Successful intraday trading depends on technical tools such as indicators, volume analysis, and—most importantly—chart patterns that reflect real-time market psychology.
What Are Chart Patterns?
Chart patterns are recognizable price formations that appear repeatedly on charts. They are created by the interaction between buyers and sellers and reflect shifts in supply, demand, and market sentiment. By studying these formations, traders attempt to forecast the most probable next price move.
Why Are Chart Patterns Important for Intraday Traders?
For intraday traders, timing is critical. Chart patterns provide structured entry and exit points, helping traders act decisively rather than emotionally. When combined with volume and confirmation signals, patterns can improve trade accuracy and reduce false entries.
Types of Chart Patterns
Chart patterns are generally divided into two main categories:
Reversal Patterns
These patterns suggest that the current trend may be coming to an end and that price could reverse direction.
Examples include:
- Head and Shoulders
- Double Top
- Double Bottom
- Rounding Bottom
Continuation Patterns
These indicate a temporary pause before the prevailing trend resumes.
Examples include:
- Flags and Pennants
- Triangles (Ascending, Descending, Symmetrical)
- Wedges
- Cup and Handle
1. Head and Shoulders
The Head and Shoulders pattern is one of the most reliable reversal patterns in technical analysis. It typically forms after an uptrend and signals a potential transition from bullish to bearish conditions.
The pattern consists of three peaks:
- A left shoulder
- A higher central peak (the head)
- A right shoulder that is similar in height to the left
A key component of the pattern is the neckline, drawn by connecting the swing lows between the shoulders and the head. A confirmed break below the neckline indicates that selling pressure has overtaken buying momentum.
Traders often wait for this neckline break before entering short positions. Volume behavior strengthens the signal: volume usually decreases during the formation of the head and increases during the breakdown, confirming bearish intent.
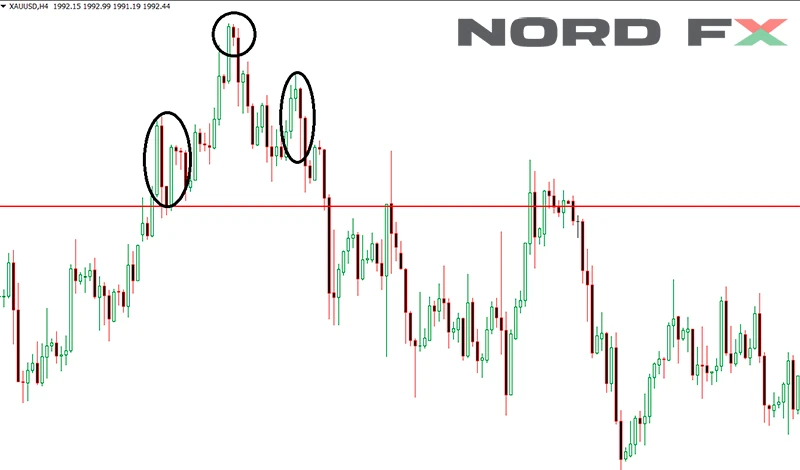
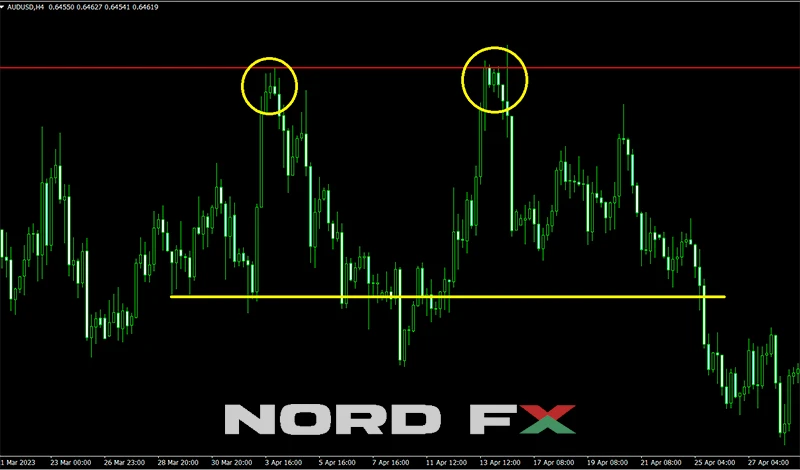
2. Double Top
The Double Top is a classic bearish reversal pattern that appears after a sustained uptrend. It forms when price reaches a resistance level twice and fails to break higher both times.
Visually, the pattern resembles the letter “M”:
- Two similar peaks
- A trough between them acting as support
The pattern is confirmed when price breaks below the support level formed by the trough. This breakdown signals weakening bullish momentum and the potential start of a downtrend.
Traders often monitor volume closely—lower volume on the second peak can indicate buyer exhaustion and strengthen the reversal signal.
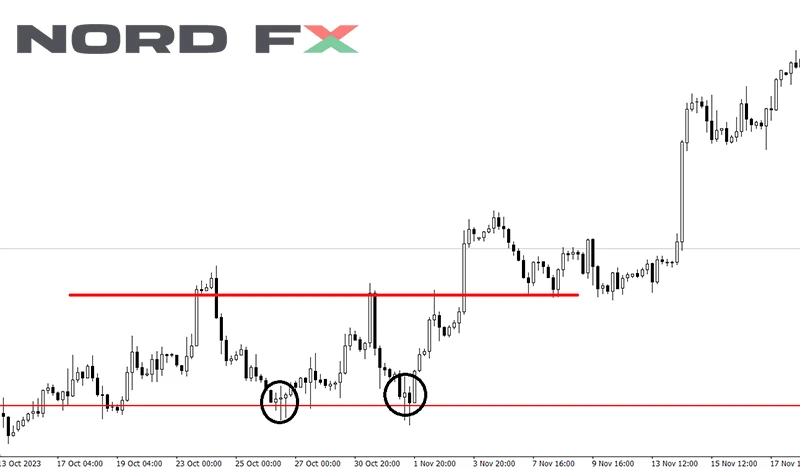
3. Double Bottom
The Double Bottom is the bullish counterpart to the Double Top and signals a potential reversal from a downtrend to an uptrend.
It forms when price tests a support level twice and holds both times, creating a “W” shape. The resistance level between the two lows acts as the neckline.
A breakout above this neckline confirms the pattern and suggests renewed buying pressure. Increased volume during the breakout adds further confirmation.
Intraday traders often use the Double Bottom to identify early trend reversals and structure long entries with clearly defined risk.
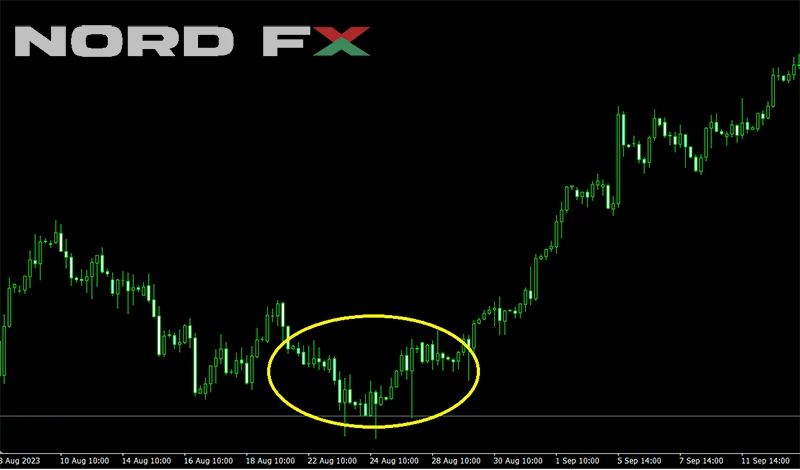
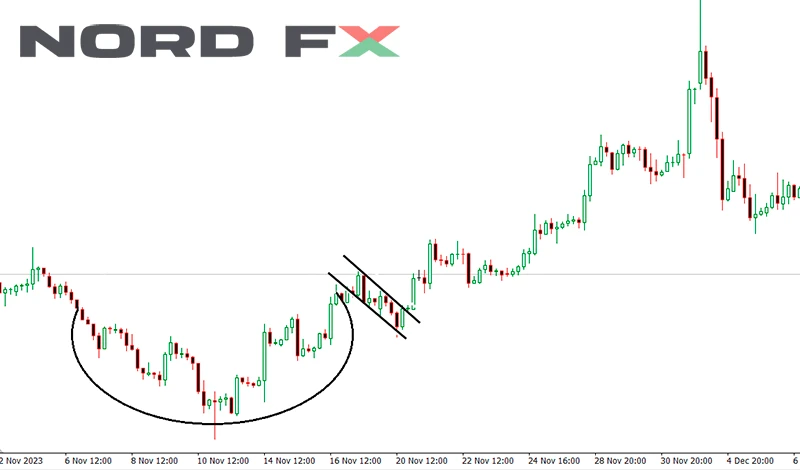
4. Rounding Bottom
The Rounding Bottom, sometimes called a saucer bottom, represents a slow and gradual shift from bearish to bullish market sentiment.
Unlike sharp reversals, this pattern develops over time, forming a smooth U-shaped curve. It reflects a transition period where selling pressure gradually diminishes and buyers steadily regain control.
The pattern is confirmed when price breaks above resistance near the beginning of the formation. Because of its gradual nature, the Rounding Bottom often signals a more sustainable trend change rather than a short-lived bounce.
5. Cup and Handle
The Cup and Handle is a bullish continuation pattern that often appears after an uptrend. It consists of two parts:
- The cup: a rounded pullback resembling a bowl
- The handle: a short consolidation or shallow retracement
The handle represents a final period of consolidation before price breaks out above resistance. A strong breakout accompanied by increased volume confirms the pattern and signals trend continuation.
This pattern is popular among both intraday traders and swing traders due to its clear structure and favorable risk-to-reward profile.
6. Wedges
Wedges form when price moves within narrowing trend lines, indicating decreasing volatility and an impending breakout.
There are two main types:
- Rising wedge: often bearish, appearing during uptrends
- Falling wedge: typically bullish, appearing during downtrends
A wedge is confirmed when price breaks decisively out of the formation, usually with increased volume. Traders use wedges to anticipate either trend reversals or continuations depending on the context.
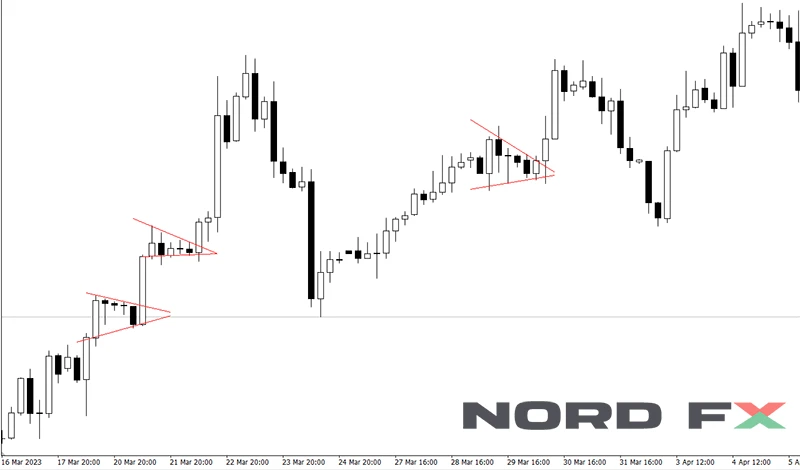
7. Pennants and Flags
Flags and pennants are short-term continuation patterns that appear after a strong price move, known as the flagpole.
- Flags form rectangular consolidations
- Pennants form small symmetrical triangles
Both patterns represent brief pauses before the market resumes its prior direction. Declining volume during consolidation and a volume surge during breakout are typical confirmation signals.
These patterns are particularly useful for intraday traders seeking quick continuation trades.
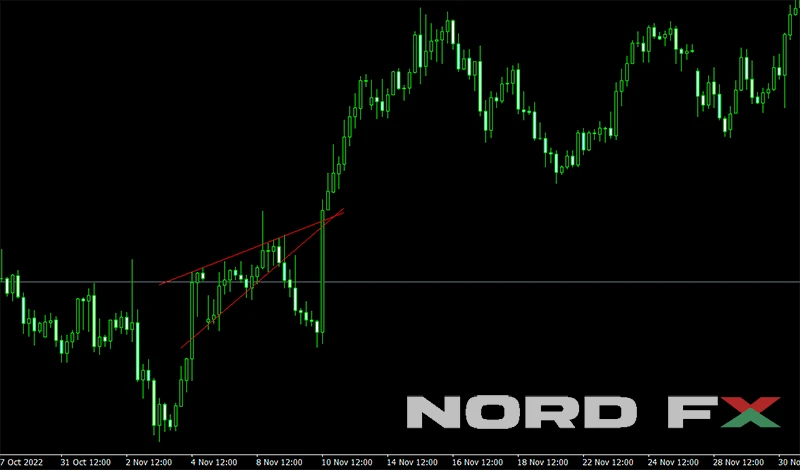
8. Ascending Triangle
The Ascending Triangle is a bullish continuation pattern characterized by:
- A horizontal resistance level
- Rising support formed by higher lows
This structure indicates increasing buying pressure. A breakout above resistance, especially with strong volume, confirms the pattern and suggests further upside.
Intraday traders favor this pattern for its clearly defined breakout level and stop-loss placement.
9. Descending Triangle
The Descending Triangle is a bearish continuation pattern that mirrors the Ascending Triangle.
It features:
- A flat support level
- Descending resistance formed by lower highs
A breakdown below support confirms seller dominance and often leads to continued downside movement. Volume expansion during the breakdown strengthens the signal.
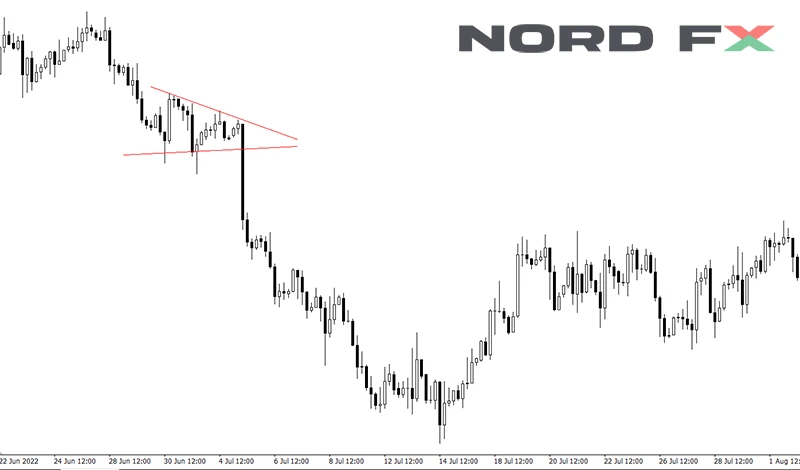
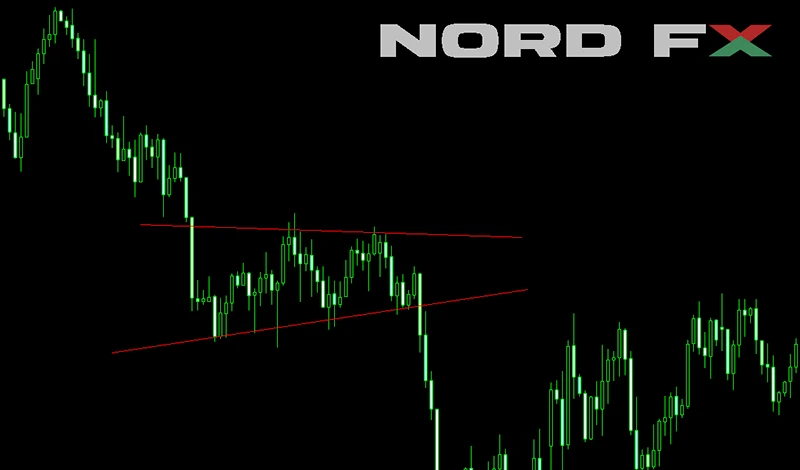
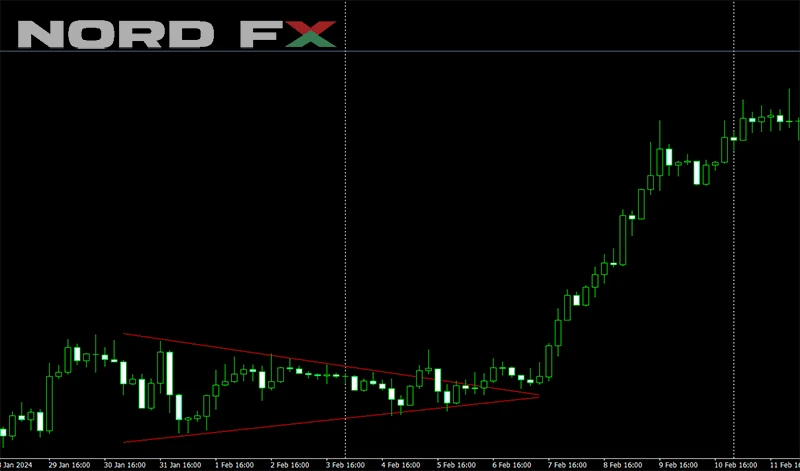
10. Symmetrical Triangle
The Symmetrical Triangle reflects a period of market indecision, with price forming lower highs and higher lows.
Unlike ascending or descending triangles, this pattern has no directional bias until a breakout occurs. Traders wait for confirmation in the form of a decisive breakout with increased volume.
Once confirmed, the breakout often leads to a strong directional move, making this pattern valuable for intraday volatility trades.
Applying Chart Patterns to Intraday Trading
Identifying Patterns
Successful pattern trading requires early and accurate identification. Traders often combine visual analysis with tools such as trend lines, moving averages, and volume indicators to improve reliability.
Strategy Development
After identifying a pattern, traders define:
- Entry points
- Stop-loss levels
- Profit targets
This structured approach helps reduce emotional trading and supports consistent decision-making.
Analyzing Chart Patterns
Volume and Price Analysis
Volume is a critical confirmation tool. Breakouts supported by rising volume are generally more reliable than those occurring on low participation.
Time Frames
Intraday traders often analyze multiple time frames to validate patterns. A setup on a lower time frame that aligns with a higher-time-frame structure carries more weight.
Confirmation and Psychology
Chart patterns reflect trader psychology. Reversal patterns highlight shifts in sentiment, while continuation patterns reveal pauses before trend resumption. Waiting for confirmation helps filter false signals.
Risk Management
Effective risk control is essential. Stop-loss orders are typically placed beyond key pattern levels to limit downside exposure if the setup fails.
Tools and Resources for Chart Pattern Trading
- Charting platforms with advanced drawing tools
- Indicators for volume and momentum confirmation
- Pattern-recognition features for faster analysis
- Trading simulators for practice without risk
- Educational content and trading communities
These resources help traders refine pattern recognition skills and improve execution.
Frequently Asked Questions
What are the most reliable intraday chart patterns?
Head and Shoulders, triangles, flags, and pennants are among the most widely used and reliable patterns when confirmed by volume.
How long does it take to learn chart pattern trading?
Basic proficiency can be achieved within a few months of consistent practice, but mastery requires ongoing experience and market exposure.
Can chart patterns be used in all markets?
Yes. Chart patterns apply across forex, stocks, commodities, indices, and cryptocurrencies because they are rooted in market psychology.
Is volume important for pattern confirmation?
Absolutely. Volume often determines whether a breakout or reversal is likely to succeed.
Advanced Strategies in Chart Pattern Trading
Combining Patterns with Indicators
Traders often combine patterns with RSI, MACD, or moving averages to strengthen signals and improve timing.
Backtesting Pattern-Based Strategies
Testing strategies on historical data helps identify strengths, weaknesses, and optimal risk parameters.
Behavioral Insights
Understanding emotional drivers such as fear, greed, and hesitation provides deeper insight into why patterns work.
How to Identify and Trade Intraday Chart Patterns
- Use trend lines to define structure
- Confirm setups with volume
- Wait for breakouts or neckline violations
- Define risk before entering a trade
- Set realistic profit targets based on structure
Key Takeaways
- Chart patterns are essential tools for intraday traders
- They help identify potential reversals and continuations
- Confirmation and volume improve reliability
- Risk management is as important as pattern recognition
- Consistent practice leads to better execution

