The concept of a trend is fundamental in trading on financial markets, be it in Forex, stocks, commodities, or the crypto market. Numerous trading strategies revolve around understanding and navigating trends. However, a trend is not a smooth line that one can easily follow. It is a jagged curve, abundant with unexpected turns, twists, sharp and obtuse angles, ascents, and descents. In each such moment, a trader is confronted with the question: is this a temporary pullback (or correction), after which the price will return to the main path and continue its journey towards the set goal? Or is it a dead end, where, upon hitting, the price will reverse and veer away from where it began its course? A wrong answer to this question entails the risk of losing one's deposit, while a correct one can lead to substantial profits.
What is a Trend and a Trend Breakout?
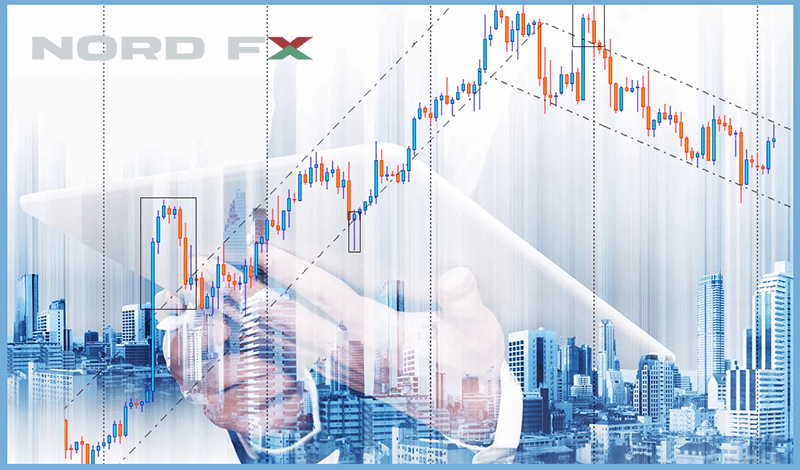
Trend in Forex and other financial markets signifies a stable and prolonged movement of an asset's price in a specific direction over a certain period within a defined trading range, constrained by support and resistance lines. Trend analysis is a key tool for traders and investors, as understanding the current trend can help in making informed trading decisions. There are three trend options: 1) Bullish (ascending): characterized by a consistent price rise, expressing optimism and faith in further market strengthening. 2) Bearish (descending): occurs when prices consistently decrease, expressing pessimism and faith in further market weakening. 3) Sideways: characterized by the absence of a clear direction in price movement, with the market fluctuating within a relatively narrow range.
Breakout signifies a situation where the price of a financial instrument surpasses a specific level of support or resistance, indicating a potential change in the current trend. Simply put, this occurs when the price "breaks out" beyond the trading range or trend, signalling a possible shift in market sentiment.
There are two possible scenarios for further developments. The first is a genuine breakout. In this case, the price, after surpassing the trend boundaries, no longer returns to previous values but moves in the opposite direction. The second is a false breakout. Similar to a true breakout, the chart crosses support or resistance. However, the momentum is not strong enough, and the price returns to previous values before continuing in the trend direction. False breakouts occur regularly and result from crowd behaviour. This is more common among novice traders who believe they are opening positions at the safest moment, but often, that is not the case. As a result, they fall into bullish or bearish traps, which may be intentionally set by larger and more experienced players.
What is a Correction or Pullback?
Another trap, similar to a false breakout, for a trader can be a correction (or pullback) in the price. In the terms of the Forex market, this phenomenon also represents a temporary change in the price of an asset in the direction opposite to the current trend. The key word here is "temporary." Thus, on the one hand, a trader can increase their profit by opening a trade in the direction of the trend during a correction. On the other hand, if they make a mistake and open a trade against the trend, they will incur losses.
Why do corrections or pullbacks occur? There are several reasons why the market may undergo a correction. Firstly, it may be caused by traders taking profits after a significant move in one direction. Secondly, factors such as economic news or events can change market sentiments, leading to a temporary change in price.
As mentioned earlier, understanding corrections and pullbacks in the Forex market is a key element of successful trading. Traders must be able to differentiate between a temporary trend change and its more long-term shift to make informed decisions and capitalize on the dynamic world of currency and other markets.
How to Distinguish Correction from a Change in Trend
Here are several ways to determine whether the market movement is a correction or the beginning of a long-term trend change:
– Support and Resistance Levels play a crucial role in determining the current market condition. If, after bouncing off the trend line, the price encounters a support/resistance level on its way and, after rebounding, returns to the trend line, this may be a sign of a correction. Conversely, a breakout of such a level may indicate a possible trend change. However, much depends on the strength of this level.
– Analyzing trading volumes can also be useful. Movement along the trend or an actual trend change is usually accompanied by an increase in volume, confirming the strength of the movement. In contrast, a correction may be accompanied by low volume, indicating insufficient market support.
– To confirm a trend change, you can use technical indicators such as MACD (Moving Average Convergence Divergence), Relative Strength Index (RSI), Stochastic Oscillator, or ADX (Average Directional Index). These tools help determine the strength of the current trend and the possibility of its change. They help identify moments when the market is overbought or oversold, which can serve as a trigger for a possible correction or trend change.
– It's important to consider news and fundamental factors that may impact the market. Significant events confirming price movement can be a key factor in distinguishing a real trend change from a temporary correction.
– Examining price movement on various time frames can provide a more comprehensive understanding of the strength of the movement. A real trend change will be visible on different time horizons, including larger ones.
How to Determine Trading Volume
Where can a trader find real-time trading volume? Below, we'll outline several ways to do this. It's important to remember that these volumes may vary depending on the time of day (the activity of a particular market), calendar days (holidays, the end of the financial month, quarter, or year), and, consequently, market liquidity. So, how can one determine trading volumes:
– Exchange Data: Some exchanges provide real-time trading data, including volumes. This information may be accessible through exchange websites or specialized services.
– Technical Indicators, such as On-Balance Volume (OBV) or Volume Weighted Average Price (VWAP), can be used to track trading volumes in real-time.
– There are also analytics and news platforms that offer data on current trading volumes. Traders can subscribe to such services to receive up-to-date information.
– Certain financial news and information resources also provide data on current trading volumes in the market. Some are designed for professionals, while others are available to retail traders. Notable examples include Bloomberg Terminal, Reuters Eikon, CME Group, NASDAQ (Market Velocity and Market Forces tools), TradingView, Investing.com, MetaStock, Quandl.
– The MetaTrader 4 (MT4) trading platform, provided by the brokerage firm NordFX, also provides information about trading volumes. On this platform, you can easily track this information on charts. Here's how to do it: 1) Open the chart of the traded asset; 2) Select the "Insert" tab in the top menu of MetaTrader 4 and then "Indicators." 3) In the "Volumes" section, choose "Volumes." After adding the volume indicator, it will be displayed on the chart as a histogram below the price chart. Additionally, you can customize the volume indicator parameters, such as colours and display style, according to your preferences.
***
In conclusion, it is worth reminding that trading on financial markets always carries the risk of capital loss. To reduce the likelihood of errors, it is necessary to use a combination of approaches, along with constant monitoring and analysis of the situation. This seriously increases your chances of navigating through all the set traps and making the right, profitable decisions.
Go Back Go Back
