In the world of price action trading, few patterns are as iconic and effective as the pin bar. Simple in appearance yet deeply revealing in meaning, the pin bar reflects a clear shift in market sentiment and is often used by experienced traders to identify potential reversals and high-probability entries. While beginners may recognize its shape, seasoned forex traders understand its strategic power—especially when used in context and combined with market confluence. In this article, we take a deeper look into how professional traders interpret and apply the pin bar to gain an edge in the forex market.
Key Takeaways
- A pin bar is a precise signal of market rejection, but its effectiveness depends heavily on context and confluence.
- Advanced traders use pin bars not in isolation but alongside support/resistance, trend structure, and multiple timeframes.
- Proper risk management and experience in reading price behavior are essential to leveraging the full potential of pin bars.
What Is a Pin Bar?
A pin bar (short for “Pinocchio bar”) is a single candlestick pattern that signals a sharp rejection of price. It features a long wick (or shadow) and a small real body. The wick should be at least two-thirds of the entire candle length and should clearly protrude from surrounding price action.
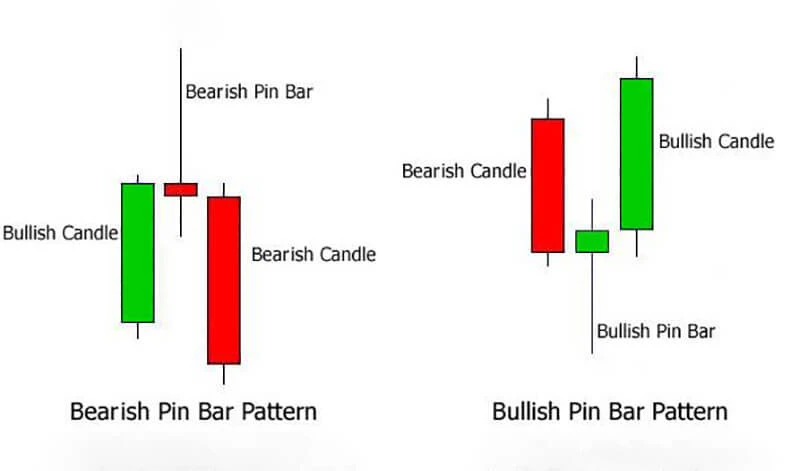
- Bullish pin bar: The long wick is below the body, showing rejection of lower prices and suggesting a potential upward reversal.
- Bearish pin bar: The long wick is above the body, indicating rejection of higher prices and a potential drop.
The ideal pin bar “nose” sticks out beyond previous candles, helping to identify a clear reversal attempt.
Market Psychology Behind the Pattern
The true strength of the pin bar lies in its psychological implications. It represents a failed attempt by buyers or sellers to push the market in one direction, quickly overwhelmed by the opposing side.
For instance, in a bullish pin bar, sellers initially push the price down aggressively. But during the same period, buyers regain control, driving the price back up and closing near the open. This rejection of lower prices reveals important order flow dynamics—often reflecting institutional activity.
Advanced traders know that this struggle, captured in a single candle, must be interpreted in the broader market context. A pin bar forming at a key support level may suggest accumulation, while one forming at resistance could reflect distribution.
Pin Bars in Different Market Conditions
Pin bars behave differently depending on the overall market environment. Recognizing these conditions is essential:
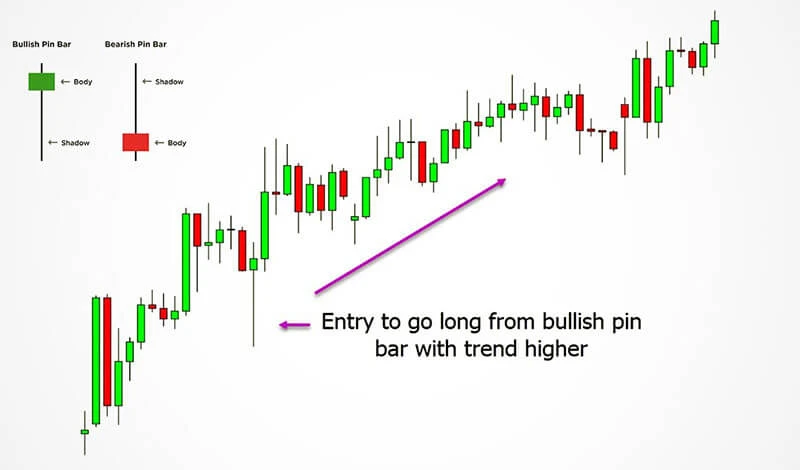
- Trending markets: In uptrends, bullish pin bars at higher lows are considered continuation signals. In downtrends, bearish pin bars near lower highs suggest further downside.
- Range-bound markets: Pin bars near the top or bottom of a range can hint at a potential reversal, but false signals are more common without strong confirmation.
Timeframe matters. On higher timeframes (D1 or W1), pin bars carry more weight as they reflect longer periods of sentiment rejection. A pin bar on H1 might be useful for short-term trades, but it's more susceptible to market noise.
Strategic Use of Pin Bars by Advanced Traders
Pin bars are rarely used as standalone signals by experienced traders. Their effectiveness increases when aligned with other technical elements:
- Support and resistance: A bullish pin bar rejecting a long-established support zone becomes a high-quality signal.
- Trendlines and moving averages: These provide structural context. For instance, a pin bar bouncing off a rising 50-period MA in an uptrend may offer a reliable entry.
- Fibonacci retracements: A pin bar aligning with a 61.8% retracement adds an extra layer of confluence.
- Multiple timeframes: A pin bar on H4 that aligns with a support level seen on D1 is more credible than a signal seen in isolation.
Entry techniques vary:
- Some traders enter immediately after the candle closes.
- Others wait for a break of the high/low of the pin bar for confirmation.
- Conservative traders may use limit orders closer to the middle of the pin bar’s wick, paired with tight stop-losses.
Stop loss is typically placed beyond the wick’s tip to allow the market breathing room while keeping the trade idea invalidated if price breaks beyond that point.
Common Pitfalls to Avoid
Even seasoned traders can make errors with pin bars. Common mistakes include:
- Trading in isolation: Ignoring market structure and relying solely on the pattern without context can lead to poor results.
- Confusing similar patterns: Not every long-wicked candle is a true pin bar. Inside bars or dojis may appear similar but convey different information.
- Ignoring volatility: During high-impact news events, pin bars may form erratically. These are often unreliable and not a product of true price rejection.
Final Thoughts
The pin bar remains one of the most versatile tools in a forex trader’s arsenal—but only when used with precision, context, and discipline. For advanced traders, it’s not just about spotting the pattern—it’s about understanding the story it tells. Mastering the pin bar requires more than chart time; it calls for thoughtful analysis, strategic planning, and the ability to filter high-probability setups from noise. And as always, combining pin bar strategies with robust risk management is the real key to long-term success.
Frequently Asked Questions (FAQ)
1. What makes a valid pin bar in forex trading?
A valid pin bar must have a long wick (typically at least two-thirds of the entire candlestick length), a small real body, and the wick should clearly reject a key price level. Its position relative to recent price action is also critical—it should “stick out” from surrounding candles.
2. Can pin bars be used as a standalone trading signal?
While pin bars can indicate a strong reversal, advanced traders rarely use them in isolation. Confluence with other technical factors—such as support/resistance, trendlines, or higher-timeframe confirmation—is essential for increasing probability.
3. What is the difference between a pin bar and a hammer or shooting star?
The pin bar, hammer, and shooting star share similar shapes but differ in context. A hammer is a bullish reversal candlestick at the bottom of a downtrend, while a shooting star is a bearish reversal at the top. The pin bar refers more broadly to a rejection candle, regardless of location, and is defined more by wick dominance and structure than label.
4. On which timeframes are pin bars most reliable?
Daily (D1) and four-hour (H4) charts tend to produce the most reliable pin bar signals due to reduced noise and greater market participation. Lower timeframes (like M15 or M5) often result in false signals unless confirmed by higher timeframe analysis.
5. Are pin bars effective in ranging markets?
They can be, especially when forming at well-defined horizontal support or resistance. However, ranging environments typically produce more false signals, so additional filters—such as volume or multiple timeframe analysis—are advisable.
6. How do institutional traders use pin bars?
Institutions often create the very price moves that result in pin bars. These candles can reflect liquidity grabs (stop hunts) followed by rapid reversals. Smart traders analyze these patterns for signs of institutional footprints and use them to time entries more precisely.
7. Where should I place my stop loss when trading a pin bar?
A common technique is placing the stop loss a few pips beyond the wick of the pin bar. This allows for natural price fluctuation without invalidating the trade setup. However, always calculate stop distance relative to position size and overall risk management rules.
Go Back Go Back
