First, a review of last week’s forecast:
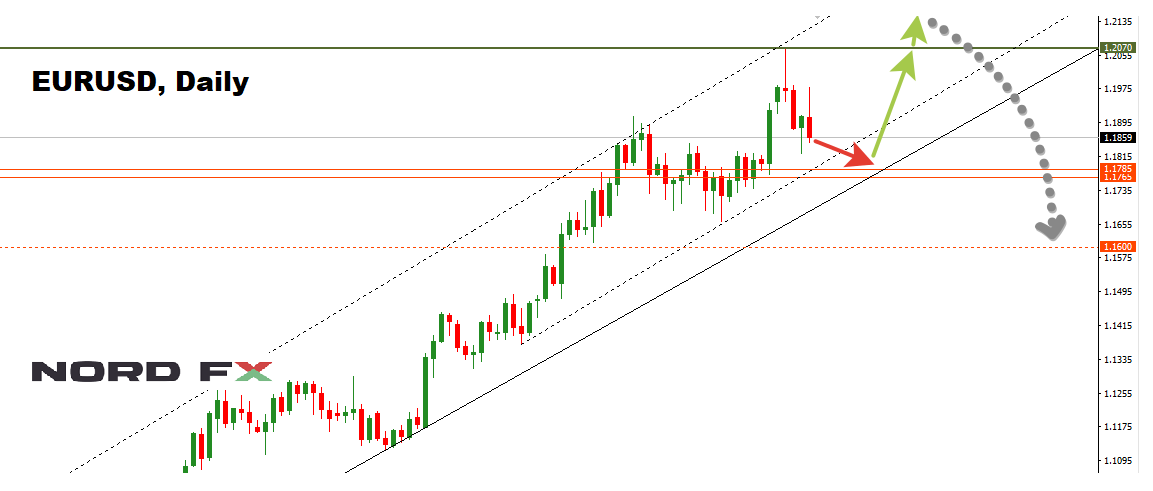
- EUR/USD. Recall that, although a quarter of oscillators were already signaling that this pair had been overbought, the bulk of them, supported by 100% of trend indicators and 40% of experts, insisted that the pair still had enough strength to rise at the very least to 1.2040. This is indeed what it did. On Tuesday, August 29, the pair overcame 1.2000, before rising another 40 points, and then, by inertia, by another 30. Having fixed a maximum at 1.2070, it turned and rushed downwards, having lost 250 points by the last day of summer. The pair completed the first day of autumn at 1.1860;
- As for the future of GBP/USD, the camps of both experts and indicators were full of discord – some were looking northwards, some to the west, and some southwards. In this situation, we advised paying attention to the readings of graphical analysis. This advice turned out to be correct. Both on H4 and D1, its forecasts predicted an initial growth of the pair to the zone of 1.3000, followed by a reversal and a fall. This is what happened. By Tuesday, the pair had risen by almost 100 points and, after failing to reach the coveted mark, it descended. Having fixed the local bottom at 1.2850, it took another leap upwards, coming close to the goal on Friday, when it reached 1.2995. It then rolled back to the lower boundary of the 1.2950-1.3000 range;
- The forecast for USD/JPY was very brief last week. It had been noted that the majority of analysts (70%), supported by 90% of the indicators, expected the pair to fall to the lows of April 2017 at 108.12. The pair obeyed this order, if not by 100%, then by 95%, having descended to 108.26. After that, like a spring, it quickly straightened up and, having overcome 240 points, conquered the height of 110.66 on August 31;
- USD/CHF. 70% of experts, graphical analysis on D1 and about 20% of oscillators spoke about the possible growth of this pair. It was not ruled out that, before moving northwards, it could drop to the support at 0.9430. That's exactly what happened: first the pair declined by 150 points, and then, pushing away from 0.9426, it rose, ending the five-day period in the long-term support/resistance zone near 0.9650.
As for the forecast for the coming week, summarizing the opinions of analysts from a number of banks and brokerages, as well as forecasts made on the basis of a variety of methods of technical and graphical analysis, we can say the following:
- EUR/USD. It is very difficult to give a forecast for this pair, as the opinions of analysts are divided equally, split 50%/50%. The same can be said about the indicators. The market does not expect any surprises from the ECB rate decision or from the comments of its leaders on Thursday, September 7. Therefore, focusing on the readings of graphical analysis on H4 and D1, one can expect this pair to continue its uptrend, which began as early as this January. The main support is around 111.60. Resistance is at the levels of 1.2000 and 1.2070, with the ultimate target being1.2150.
As for a longer-term forecast, almost 75% of analysts believe that the dollar will be able to regain some of its positions in the coming months, bringing the pair closer to 1.1600. Nevertheless, it is very difficult to make any concrete predictions whilst President Trump resides in the White House;

- Graphical analysis on H4 indicates a continuation of the uptrend for the pair GBP/USD. 45% of analysts and 80% of indicators agree with this. The nearest target is 1.3060, whilst the next target is 1.3115.
An alternative point of view is represented by 55% of experts and 20% of oscillators, who indicate that the pair is overbought. Graphical analysis on D1 agrees with them. According to its readings, the pair will drop first to the support of 1.2775, and only then, having beaten off from it, will depart to the height of 1.3060. In case of a break through 1.2775, the next support is 100 points lower; - As predicted, USD/JPY continues the cyclical wave movement in the medium-term side channel in the range of 108.12-114.50. Last week, having fixed a minimum, the pair returned to the lower border of the Pivot-zone of the channel at the level of 110.25. At the same time, 55% of experts claim that before finally turning northwards, the pair will once again try to test the bottom of the channel and descend to at least 108.80;
- The last pair of our review is the USD/CHF. Here, most analysts (about 60%) expect that it will again fall to the minimum of August 29, at 0.9426. This development is supported by graphical analysis and more than half of the oscillators on D1, the readings of which indicate that this pair is overbought. The main resistance is in the 0.9700-0.9725 zone; the next one is at 0.9770.
Roman Butko, NordFX
Go Back Go Back
