First, a review of last week’s forecast:
- Last week, we were unwilling to give any forecast for EUR/USD pair. Our reluctance proved to be well-founded. Recall that there was a complete discord both among experts and among indicators: some were looking to the north, some south, and some were simply shrugging shoulders, unable to predict anything. The pair seemed to feel it: it first went down, then up, then down again ... As a result, it did not opt for either direction, and finished the five-day period near 1.1780, the Pivot level, around which it has been gravitating for four weeks;
- Speaking about the future of the GBP/USD, 55% of analysts, along with graphic analysis on D1, sided with the bears, forecasting that the pair would fall to the support at 1.3150, and, in the event of a breakdown, 110 points lower. This is what happened: starting on Monday, the pair began to lose point after point, reaching the level of 1.3150 on Wednesday. Then it made several attempts to break through this level, and managed to reach the1.3085 mark on Friday. However, the forces of the bears dried up, and by the end of the five-day period the bulls managed to win 100 points, thereby rising to 1.3185;
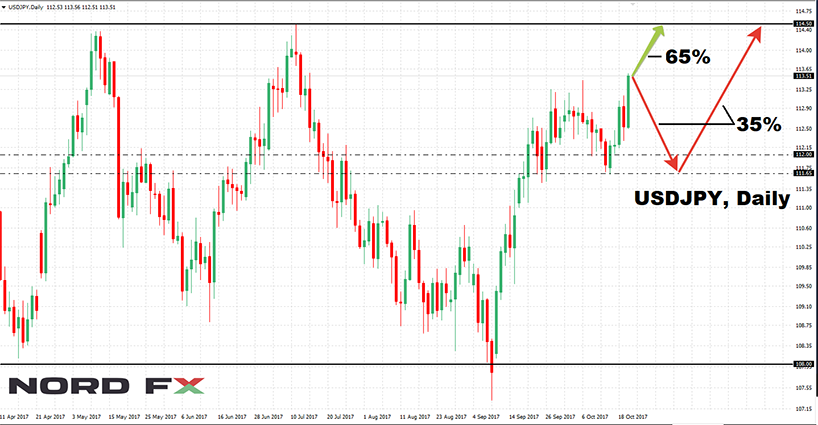
- USD/JPY. The forecast for this pair also turned out to be absolutely correct. Supported by the oscillators, the experts agreed that this pair was on the way to the upper boundary of the mid-term lateral channel 108.00-114.50, and that one should expect an upwards spurt. This ended up being just under 200 points; as a result, the pair fixed a weekly maximum at the height of 113.56, failing to reach the final goal by approximately a meager 100 points;
- USD/CHF. Here the bulls were granted a slight advantage only by the readings of graphical analysis on H4, according to whom the pair’s target was the zone 0.9800-0.9835. As for the analysts, only 25% of them voted for the growth of the pair. But it was to these voices that we had to listen, as the pair added about 100 points during the week, completing the weekly session in the zone of 0.9840.
As for the forecast for the coming week, summarizing the opinions of analysts from a number of banks and brokerages, as well as forecasts made on the basis of a variety of methods of technical and graphical analysis, we can say the following:
- EUR/USD. It is worth noting that the expert community has been unable to form a clear opinion on the behavior of this pair for two weeks now. Despite the decision of the US Senate to approve the draft budget for 2018 and allow the implementation of Trump's tax reform, only 50% of analysts voted for the strengthening of the dollar. According to their opponents, even if the dollar goes further up, this growth will be short-lived.
Following the analysts, oscillators and trend indicators on D1 either disagree or simply take a neutral position. And it is only on H4 that they point to a downtrend. As for the graphical analysis, it draws a lateral channel in the range 1.1665-1.1925. The following support is in zone 1.1575.
It should be noted that when moving to the medium-term forecast, the picture changes dramatically, and about 80% of the experts vote for the growth of the pair to the area of 1.2000-1.2100; - The outlook for GBP/USD is negative. This is the viewpoint that most (55%) analysts still adhere to. The nearest support is in the 1.3000 zone. In addition to experts, 70% of trend indicators and graphical analysis on D1 side with the bears.
As for the bulls, they are supported by the remaining 45% of experts, according to whom the pair may once again try to test the October maximum in the 1.3335 zone; - Like last week, USD/JPY is once again facing a green light. 65% of analysts, 100% of trend indicators and 75% of oscillators on H4 and D1 believe that the growth of the pair to the upper boundary of the medium-term channel of 108.00-114.50 will be continued. We must not forget, however, that certain corrections are possible along this path. This is what the remaining 25% of the oscillators signal about when indicating that the pair is overbought. And, as practice shows, such signals are often enough to make the pair to descend for a short while. The nearest support is in the 112.00-112.30 vicinity, with the next one being 111.65;

- Finally, the last pair of our review: USD/CHF. A quarter of the oscillators on H4 and D1 indicate that this pair is overbought, with 65% of experts looking southwards. Moreover, when moving from the weekly forecast to the monthly one, their number increases to almost 85%. All of them expect the pair to fall first to the horizon of 0.9700, and then by yet another 100 points.
The bull supporters that remain, backed by graphical analysis of H4, believe that the potential for growth of this pair has not yet dried up and it has a chance to rise to 0.9900, or, perhaps, even higher to the landmark level of 1.0000. However, here much will depend on the EUR/USD pair, whose behavior USD/CHF often mirrors.
Roman Butko, NordFX
Go Back Go Back
