The Stochastic Oscillator has long been a favorite among technical traders for identifying momentum shifts and potential reversals. Originally developed by George Lane in the 1950s, the indicator continues to be highly relevant today—particularly when customized and combined with other tools.
This guide goes beyond the basics. Here, you'll find how to set up the Stochastic Oscillator for different asset classes, optimize its parameters, use it with other indicators, and apply advanced interpretations like hidden divergences and trend-following entries.
Understanding the Mechanics of the Stochastic Oscillator
At its core, the Stochastic Oscillator compares a security’s closing price to its price range over a defined number of periods. It consists of two lines:
- %K = (Current Close – Lowest Low) / (Highest High – Lowest Low) × 100
- %D = A moving average (typically 3-period SMA) of %K
Readings range from 0 to 100. The most common interpretations:
- Above 80: Overbought
- Below 20: Oversold
- Crossovers: %K crossing above %D is bullish; crossing below is bearish
These signals, however, should not be used in isolation, especially in trending markets.
Variants and Settings: Fast, Slow, and Full
Advanced traders often tailor the oscillator to fit specific strategies or market conditions.
- Fast Stochastic: %K (5) and %D (3) – very responsive, more noise
- Slow Stochastic: Smooths the Fast version, using %K (3) and %D (3)
- Full Stochastic: Fully customizable – traders can adjust all three parameters
For instance:
- Fast (5,3) is better for scalping or volatile crypto assets
- Slow (14,3,3) is more stable and suited for swing or position trading
- Full (10,5,5) offers balance on medium timeframes
Practical Setup Across Markets
Let’s walk through four practical examples across different asset classes using NordFX MT4/MT5 chart setups.
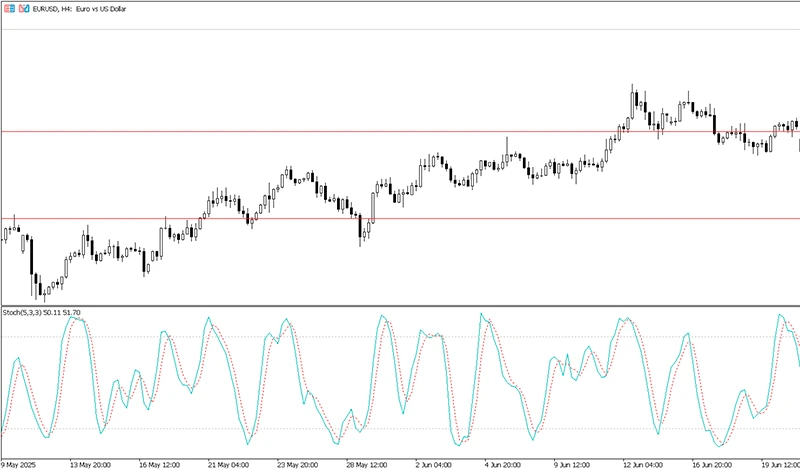
Forex: EUR/USD on H4 (Stochastic 5,3,3)
In this chart, the oscillator frequently oscillates between 20 and 80, providing short-term reversal setups. A notable bullish signal occurred when %K crossed above %D below the 20-level while the price held above support at 1.12816. The follow-through rally broke the 1.15091 resistance, confirming the signal.
Traders often wait for confirmation such as:
- A bullish engulfing candle at the crossover
- Trendline breakout or strong support confluence
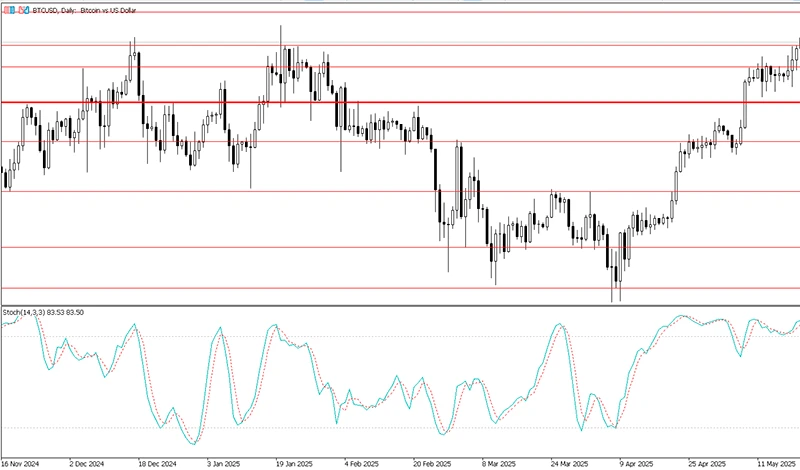
Crypto: BTC/USD Daily (Stochastic 14,3,3)
Bitcoin’s price showed strong momentum when the oscillator rebounded from oversold territory and crossed above the 20-level. In this case, the stochastic reached overbought levels and hovered near 80–90 as price pushed into key resistance at 107340.09.
Crypto markets often remain overbought or oversold for extended periods. In such cases, traders may consider:
- Using stochastic as a trend strength gauge
- Combining with MACD to confirm bullish bias
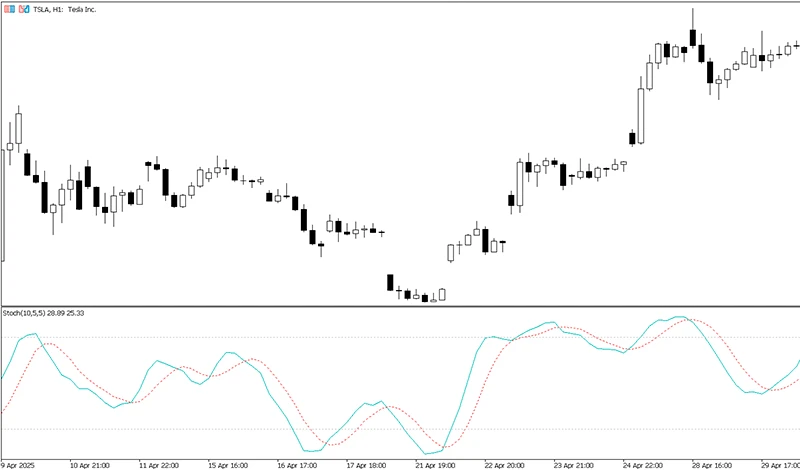
Stocks: TSLA H1 (Stochastic 10,5,5)
Tesla’s hourly chart showed a bullish divergence—price made a lower low, while stochastic formed a higher low. This is a classic hidden divergence, indicating weakening downside momentum and potential for a reversal.
Divergence-based strategies on individual stocks often work well when coupled with:
- Volume confirmation
- Trendline breakout
- Earnings or macro event catalysts
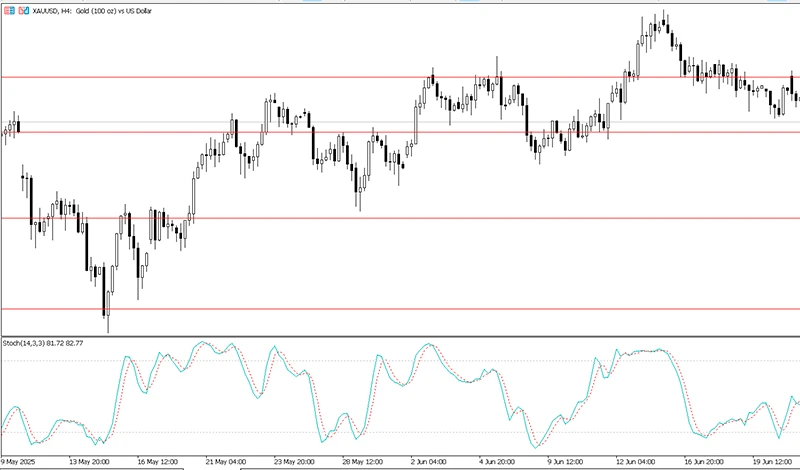
Commodities: XAU/USD (Gold) H4 (Stochastic 14,3,3)
On this gold chart, we observe multiple swings where stochastic reversals aligned with price bounces at support and resistance. When %K crossed %D below 20, price rebounded from the 3145 support, eventually pushing past the 3326 level.
Gold often reacts sharply to stochastic crossovers during economic data releases. Advanced traders may filter signals using:
- Fibonacci retracement levels
- Time-based cycles (e.g., weekly reversal windows)
Advanced Interpretations
Experienced traders go beyond simple crossover signals.
Hidden vs. Regular Divergences
- Regular divergence: Signals potential trend reversal
- Hidden divergence: Signals trend continuation
Hidden bullish divergence occurs when price forms a higher low while stochastic makes a lower low. It's often a more reliable signal than regular divergence when trading in the direction of the trend.
Stochastic as Trend Filter
Rather than using stochastic for entries, some traders use it to filter trades:
- Enter only long trades when stochastic is above 50
- Avoid short trades if stochastic is rising above the midline
Combining Stochastic with Other Tools
Stochastic Oscillator becomes significantly more powerful when combined with other technical methods.
MACD
- Look for both indicators to signal the same direction
- Use MACD to confirm the trend, stochastic for timing
Moving Averages
- Filter trades based on whether price is above/below the 50 or 200 EMA
- Avoid taking long trades if stochastic gives bullish signal but price is under long-term moving average
Trendlines and Chart Patterns
- A stochastic crossover at a breakout point enhances confidence
- Triangle breakouts or double bottoms are excellent setups for confirmation
Candlestick Patterns
- Pin bar or engulfing pattern near stochastic reversal adds a price-action layer
- Helps to avoid taking signals blindly
Modern Variations and Enhancements
Innovations have expanded how the Stochastic Oscillator is used.
Stochastic RSI
A momentum oscillator of RSI itself, this tool is extremely sensitive and is best for short-term timing within broader RSI setups.
Adaptive and Machine-Learning Based Stochastics
Some trading systems use:
- Adaptive smoothing based on volatility
- AI-trained algorithms to optimize stochastic parameters in real time
- Backtest optimization for best-fit stochastic settings per asset
These tools are available in certain algorithmic platforms and allow high-frequency applications of stochastic logic.
Pros and Cons of the Stochastic Oscillator
Pros
- Excellent for identifying early momentum shifts
- Customizable to suit any timeframe or strategy
- Simple visual interpretation
Cons
- Generates false signals in trending markets
- Requires filters or confirmation to avoid whipsaws
- Overbought/oversold readings can persist during strong trends
Comparison to Other Indicators
Indicator | Best For | Weakness |
Stochastic | Momentum reversals | False signals in trends |
RSI | Overbought/Oversold with trend | Less responsive |
MACD | Trend confirmation | Lagging in fast markets |
Williams %R | Rapid shifts in price extremes | More volatile than stochastic |
The key to choosing the right tool is understanding its purpose. While MACD and RSI are more trend-based or smoothed, the stochastic excels in catching momentum shifts and short-term exhaustion.
Final Thoughts and Best Practices
The Stochastic Oscillator remains one of the most versatile tools for advanced traders—when used correctly. Tailoring settings, filtering trades, and applying cross-confirmation can elevate stochastic strategies beyond simple overbought/oversold logic.
To use it effectively:
- Avoid using it alone
- Calibrate your settings per asset
- Pair it with price action, structure, and confluence zones
Used in this way, the stochastic becomes not just an oscillator—but a precision timing instrument in your overall trading system.
Go Back Go Back
