Price swings are inevitable in financial markets, often creating both exciting opportunities and significant risks. For intermediate traders looking to enhance their trading arsenal, understanding the intricacies of these fluctuations—why they happen, how to spot them early, and ways to leverage them effectively—is essential. This article dives deep into the anatomy of price swings, highlights essential indicators, explores proven strategies, and addresses the psychological aspects every trader must master to thrive amidst market volatility.
Key Takeaways:
- Price swings occur due to various factors, including market sentiment shifts, economic news, and technical levels.
- Indicators such as Bollinger Bands, RSI, and Fibonacci retracements can significantly aid in recognizing potential swings.
- Effective swing trading strategies combine technical analysis, disciplined risk management, and strong psychological resilience.
Price Swings: Causes and Triggers
Price swings occur as markets continually reassess value, reflecting the changing perceptions of traders and investors. For intermediate traders, recognizing these triggers can provide critical foresight. Key catalysts often include:
- Economic Data Releases: Unexpected outcomes from employment reports, GDP figures, inflation data, or central bank decisions can trigger abrupt and substantial price movements.
- Market Sentiment and Speculation: Traders' collective optimism or pessimism can dramatically shift, amplifying volatility.
- Technical Levels and Stops: Significant support or resistance levels, once broken, often lead to accelerated price movements due to triggered stop-loss orders or breakout traders entering positions.
For example, in March 2020, equity markets experienced drastic price swings triggered by the unprecedented global COVID-19 pandemic. Central bank interventions and rapidly changing economic outlooks created multiple high-volatility swing opportunities for traders.
.webp)
Indicators to Predict Price Swings
Intermediate traders benefit significantly from leveraging technical indicators to accurately identify and anticipate potential market swings. Understanding and properly interpreting these indicators can make the difference between successful trades and costly mistakes. Among the wide array of available technical tools, the following indicators stand out for their effectiveness in pinpointing price swings:
• Bollinger Bands:
Bollinger Bands are widely favored for their ability to visually represent market volatility. Comprising an upper band, a lower band, and a central moving average line, Bollinger Bands dynamically adjust their width based on volatility levels. When volatility increases, the bands expand; during lower volatility periods, they contract. Price movements that approach or breach the outer bands often indicate potential swing reversals or breakouts, giving traders valuable signals about when volatility might rise significantly or decrease. Intermediate traders commonly watch for price action to touch or exceed these bands as a cue to either prepare for reversals or capitalize on breakout moves.
• Relative Strength Index (RSI):
The RSI is a momentum oscillator designed to measure the speed and magnitude of recent price changes. It effectively signals whether an asset is potentially overbought or oversold, typically ranging between 0 and 100. Traders frequently interpret readings above 70 as indicators that prices have become excessively elevated, making a pullback or bearish reversal increasingly likely. Conversely, readings below 30 suggest oversold conditions, hinting at a possible bullish reversal. Intermediate traders often incorporate RSI divergences—when price and RSI move in opposite directions—as powerful clues that a trend reversal could be imminent.
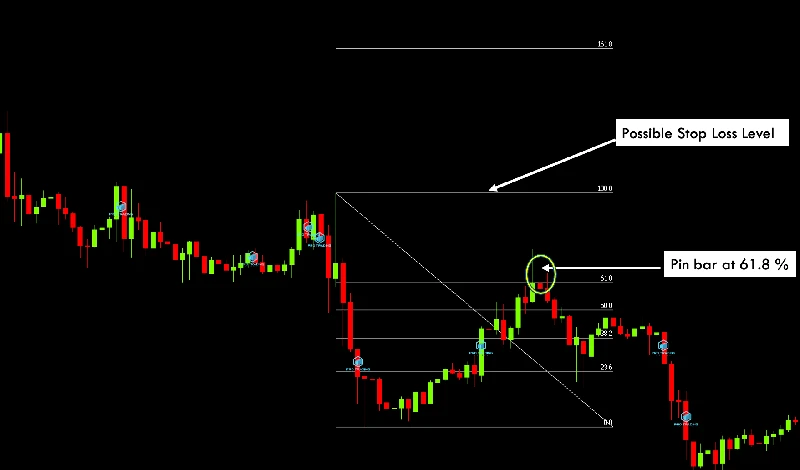
• Fibonacci Retracements:
Fibonacci retracement levels are highly regarded due to their ability to reveal potential turning points following sharp price movements. Traders plot these levels by connecting a significant peak and trough to identify key support and resistance levels, commonly at the 23.6%, 38.2%, 50%, 61.8%, and 78.6% marks. While each level has significance, the 38.2%, 50%, and particularly 61.8% levels are most frequently monitored. Traders anticipate that prices approaching these Fibonacci levels might stall or reverse, providing well-defined entry or exit opportunities. Combining Fibonacci retracements with other indicators, such as RSI or candlestick patterns, often enhances reliability.
Advanced Strategies to Capitalize on Price Swings
Intermediate traders looking to refine their approach can consider the following advanced swing trading strategies:
1. Trend Continuation and Pullback Entries
Identify a clear trend, and enter positions during corrective price pullbacks, preferably confirmed by indicators like RSI divergence or Fibonacci retracement levels. This strategy aligns traders with the dominant market momentum, reducing risk and enhancing profit potential.
2. Volatility Breakout Strategy
Traders utilizing Bollinger Bands combined with volume analysis can profit significantly from volatility breakouts. Look for periods of consolidation with contracting Bollinger Bands, anticipating explosive breakouts once the bands expand and volume increases sharply.
Historical Example: The cryptocurrency markets frequently display this behavior. Bitcoin, for instance, consolidated in tight ranges several times before explosive breakouts occurred, offering substantial profits for well-positioned traders.
3. Counter-Trend Reversal Trades
Though riskier, intermediate traders can profit from sharp reversals by identifying exhaustion patterns, such as candlestick formations (e.g., hammer or shooting star) or RSI divergences. Risk management is crucial in these scenarios, as reversals may initially show false signals before confirming the swing.
Example: The S&P 500 correction in October 2018 provided traders with several counter-trend opportunities. Traders who accurately identified oversold RSI conditions and exhaustion candles profited substantially when markets reversed.
The Psychology of Trading Price Swings
Intermediate traders often underestimate the psychological demands of swing trading. Successfully navigating market volatility requires not only technical skill but also robust emotional management. Key psychological aspects include:
- Patience and Discipline: Waiting patiently for high-probability setups rather than reacting emotionally to rapid price fluctuations.
- Emotional Regulation: Remaining calm and objective, especially after experiencing losing trades or during intense volatility periods.
- Confidence through Preparation: Confidence in trading arises from rigorous preparation, strategy testing, and clearly defined trading plans.
A classic case is the market volatility surrounding the U.S. Presidential Election cycles. Traders who maintained emotional composure and followed their predetermined strategies often performed significantly better than those who succumbed to panic or euphoria.
Risk Management: Essential for Handling Price Swings
Even advanced strategies become ineffective without disciplined risk management. Intermediate traders should consider the following approaches:
- Position Sizing: Adjust positions according to volatility, reducing size in high-volatility scenarios to maintain manageable risk exposure.
- Stop-Loss Discipline: Always place protective stops based on technical validation rather than arbitrary financial risk tolerance.
- Diversification: Avoid concentrating trades in one instrument or sector prone to extreme price swings, thus spreading risk across multiple market conditions.
For instance, in commodity markets such as oil, traders who maintained disciplined position sizing during periods like the April 2020 negative-price event significantly mitigated potential catastrophic losses.
Conclusion
Understanding and mastering price swings can elevate intermediate traders to a new level of proficiency and profitability. By closely examining the underlying causes, effectively utilizing advanced indicators, refining strategies, and managing psychological and risk-related factors, traders can confidently navigate market volatility.
Price swings, while initially daunting, can become valuable allies rather than adversaries, provided traders approach them with the right tools, techniques, and mindset.
Disclaimer: This article is for educational purposes only and does not constitute financial advice.
Go Back Go Back
