What is an ascending triangle pattern?
An ascending triangle pattern is a chart formation with horizontal resistance and progressively higher lows. It suggests increasing buying pressure, with a breakout above resistance potentially signalling further price gains. However, the pattern can fail and does not guarantee an upward move.
Key takeaways
- Look for repeated highs near one resistance zone and pullbacks that finish progressively higher.
- The pattern has a bullish bias, but price can break below support instead.
- A breakout close or a successful retest can provide an entry trigger; neither guarantees success.
- Calculate the potential reward against the stop distance and trading costs before entering.
- Skip unclear formations, poor execution conditions, and setups that leave little room before nearby resistance.
What Is an Ascending Triangle Pattern?
An ascending triangle is a consolidation pattern bounded by a relatively flat upper resistance line and an upward-sloping support line. Consolidation means price is moving within a range rather than extending a sustained directional move.
Resistance is the area where advances repeatedly stall. Support connects the rising swing lows: local turning points where declines reverse. As those lows move higher, the distance between the boundaries narrows.
For example, an instrument might repeatedly approach 100 while its pullbacks end near 90, then 93, then 96. The repeated highs define resistance, while the higher lows form the ascending boundary.
The pattern describes a developing price structure. Its presence alone does not establish a profitable trade. The eventual breakout, execution price, stop placement, and available upside determine whether a particular opportunity fits a trading plan.
How to Spot an Ascending Triangle Pattern on the Chart?
Look for at least two distinct swing highs near the same price area and at least two rising swing lows. Draw the boundaries and check that price swings between them within a narrowing range.
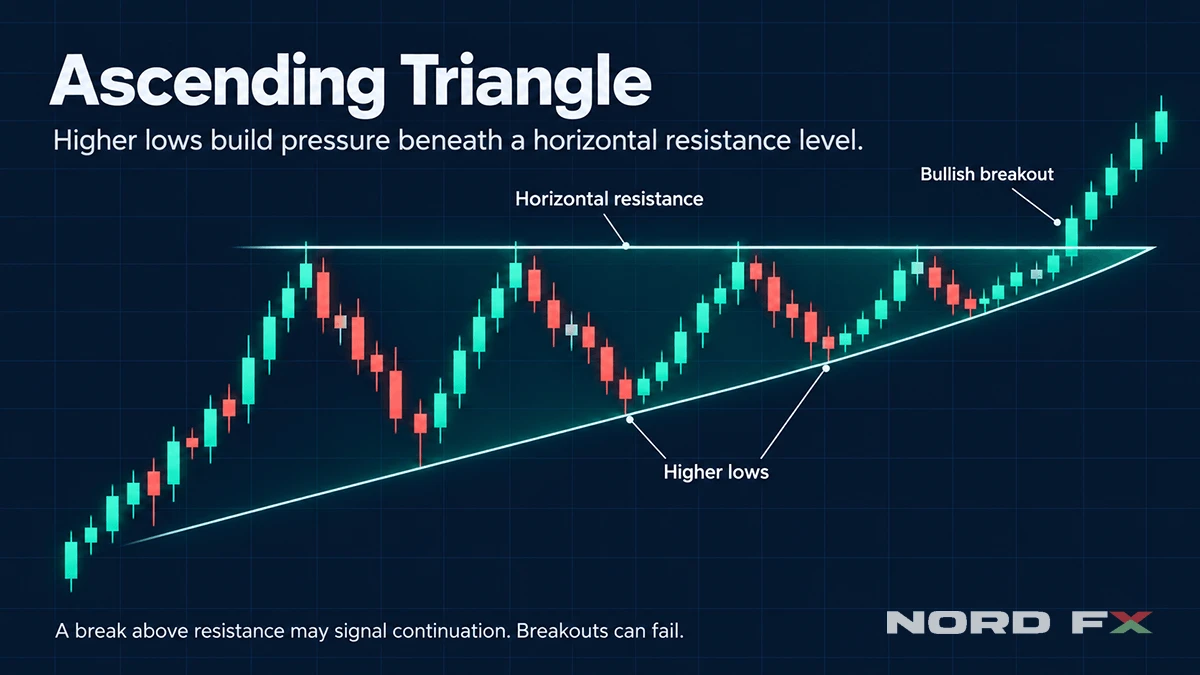
Mark zones and meaningful swings
The highs do not need to match exactly. Markets rarely respect a single precise price, so a narrow resistance zone usually represents the structure more realistically.
Connect clear turning points separated by meaningful pullbacks. Several adjacent candles pressing against the same level are not necessarily several independent tests. Use a consistent approach to candle wicks and closing prices rather than changing your drawing method to produce the desired shape.
If both boundaries rise, you may be looking at a rising wedge or channel. If the upper boundary slopes down while the lower boundary rises, the structure is a symmetrical triangle.
Check context and participation
Zoom out to see the preceding trend and nearby resistance. A triangle directly beneath a major previous high may have limited room for an upward move.
Volume can provide supporting evidence. Contracting activity during consolidation and expanding activity on an upward breakout are features technical analysts watch. However, volume does not eliminate false signals.
Check what your platform measures. Tick volume counts price updates within a period; it is not the same as the quantity traded on an exchange. Compare readings from the same instrument and data source, and avoid treating them as a complete view of market participation.
Is an Ascending Triangle Bullish?
Yes, an ascending triangle is traditionally considered bullish because its rising lows suggest buyers are accepting progressively higher prices. That interpretation describes a directional bias, not a certainty that resistance will break.
Within an established uptrend, it can act as a continuation pattern. After a decline, an upward breakout may support a possible reversal, although the wider downtrend can still create obstacles.
A move below rising support challenges the bullish interpretation. If price also breaks the latest meaningful higher low, the structure supporting the planned long trade has deteriorated.
Compare similar chart patterns
Pattern | Upper boundary | Lower boundary | Traditional interpretation |
Ascending triangle | Roughly horizontal | Rising | Bullish bias; upward break needs confirmation |
Descending triangle | Falling | Roughly horizontal | Bearish bias; downward break needs confirmation |
Symmetrical triangle | Falling | Rising | Direction unresolved until breakout |
Rising wedge | Rising | Rising more steeply | Often interpreted as bearish; downside confirmation matters |
A rising wedge is especially easy to confuse with an ascending triangle. The distinction is whether resistance remains broadly horizontal or rises alongside support. Neither shape should override what price actually does next.
Ascending Triangle Pattern Psychology
The conventional interpretation is that sellers repeatedly offer supply near resistance, while buyers become willing to enter at higher prices during each pullback. Declines therefore become shallower even though the market has not cleared the selling area.
An upward breakout may attract new buyers and trigger stop orders from traders holding short positions. Those orders can contribute to the initial move, but the chart alone cannot reveal who is trading or prove their motives.
This distinction helps avoid a common assumption: repeated resistance tests do not prove that sellers are about to disappear. Supply can be replenished, and buyers can withdraw.
If price briefly moves above resistance and then returns inside the triangle, breakout buyers may find themselves holding losing positions. Their exits can add selling pressure. This is why a plausible psychological explanation still needs an observable entry rule and a defined exit.
Ascending Triangle Trade Plan
A practical ascending triangle trading strategy specifies the trigger, invalidation point, target, position size, and costs before the trade opens.
Choose an entry method
A breakout approach waits for a candle to close above the resistance zone on the timeframe used to identify the pattern. A brief intrabar move above the boundary does not satisfy that rule. Entering after the close provides additional evidence, but the fill may be worse if price moves quickly.
A retest approach waits for price to return towards former resistance after breaking out. The trader then looks for that area to hold as support, using a predefined trigger such as a candle closing back above it. This can allow an entry nearer support, but some breakouts never retest.
Buying inside the triangle anticipates the breakout. It may offer a lower entry price, but resistance remains intact. Test these approaches separately because they expose the trader to different conditions.
Define the stop and target
Place the stop-loss where the price structure would invalidate the trade idea. For an ascending triangle breakout, this may be below the latest meaningful higher low or below the low formed during a successful retest. Allow room for normal price fluctuations rather than placing the stop directly on a trendline.
To estimate a potential target, measure the triangle’s widest vertical distance and project it above the resistance breakout level. Treat this measured move as a reference, then check whether earlier highs or other resistance zones could interrupt the advance.
Compare the distance to the target with the distance to the stop. If the potential reward does not justify the risk, skip the setup. Avoid tightening the stop solely to make the reward-to-risk ratio look more attractive.
Size the position and account for costs
Decide how much account equity you are prepared to risk before choosing the trade volume. Position size should reflect both that limit and the distance between the entry and stop-loss. A wider stop requires a smaller position to maintain the same planned risk.
Check the instrument’s contract size, tick value, and account currency when calculating the potential loss. The margin required to open a position does not represent its total risk.
Account for spreads, commissions, and any applicable overnight financing. Leave room for execution uncertainty: slippage or price gaps can cause a stop order to execute beyond the intended level. If the minimum available trade size exceeds your risk limit, leave the trade.
Manage and review the trade
Choose an exit approach before entering. You may plan to close at a target, take partial profits, or trail the stop as new price structure develops. Define how you will respond if the breakout fails, and avoid widening the stop to keep a losing position open.
After closing the trade, review the entry, exit, execution costs, and adherence to your rules. Assess results across a series of trades rather than judging the strategy by a single outcome.
Advantages of the Ascending Triangle Pattern
The pattern provides visible reference points. Resistance identifies the area buyers must overcome, while rising support helps show whether the original structure remains intact. This can make a trade hypothesis easier to define and review.
It also supports comparison before entry. A trader can evaluate breakout and retest approaches against the same boundaries, then judge whether the expected reward justifies the required stop distance.
Its basic geometry can be studied across different liquid markets and timeframes. However, trading hours, volatility, contract specifications, and costs must be assessed separately for each instrument.
When to Skip Ascending Triangle
Skip the setup when the pattern is unclear. Widely scattered highs, inconsistent higher lows, or trendlines that ignore obvious price swings make the structure difficult to interpret. A useful formation should be recognisable without repeatedly adjusting its boundaries.
Check whether nearby resistance leaves enough room for the trade to develop. If an earlier high or a major resistance zone sits just above the proposed entry, the available reward may not justify the stop distance. The triangle’s projected target does not remove those obstacles.
Avoid chasing an extended breakout. When price has already moved well beyond resistance, entering late can increase risk while reducing the remaining upside. Wait for a setup that meets your entry rules.
Be cautious around major announcements, low-liquidity periods, and unusually wide spreads. Rapid price changes and poor execution conditions can undermine an otherwise clear setup.
Skip the trade if the minimum position size exceeds your risk budget. Also reassess the pattern after repeated failed breakouts or when price drifts beyond the point where its boundaries converge. The original structure may no longer provide a useful basis for an entry.
FAQ
What is the success rate of an ascending triangle pattern?
There is no universal success rate applicable to every market and timeframe. Results depend on the pattern definition, entry, exit, costs, and testing period. Evaluate a clearly specified strategy on historical data and unseen observations before drawing conclusions.
Which timeframe is best for ascending triangles?
No single timeframe is best for every trader. Shorter charts create different monitoring demands and can make spreads more significant relative to the intended move. Choose a timeframe compatible with your schedule, holding period, and tested rules.
Does an ascending triangle need high volume?
Higher breakout volume can support the interpretation that participation has increased. It is additional evidence rather than a guarantee or a requirement that works identically across markets. Establish whether the displayed data represents traded volume or tick activity.
Can an ascending triangle break downwards?
Yes, price can break below its rising support. This weakens the bullish setup, particularly when a meaningful higher low also fails. A possible short trade requires its own trigger and risk plan; it is not an automatic response.
Does the breakout always retest resistance?
No, price may continue higher without returning to the breakout area. Waiting for a retest therefore means accepting missed trades. If a retest happens, former resistance can still fail to hold as support.
Is an ascending triangle enough to justify a trade?
The pattern supplies a setup, but the trading decision also depends on context, execution, and risk. Assess nearby price levels, event risk, costs, and position size before entering. Demo practice can help test execution rules, although live conditions may differ.
By John Gordon, Market Analyst at NordFX
กลับ กลับ
