Effective risk management is the backbone of every successful trading strategy. Markets move quickly, news surprises traders and even the most convincing technical pattern can fail without warning. Traders who remain consistent over the long term usually share one thing in common: they understand precisely how much they are willing to risk for each potential gain. The risk-to-reward ratio sits at the heart of that discipline. Although simple, it helps traders filter out weak opportunities and focus on positions that make sense mathematically as well as strategically.
This article explains how the risk-to-reward ratio works, why it plays such a central role in trading performance and how to apply it in different market environments. For those who wish to explore additional educational material, NordFX hosts a dedicated Useful Articles section where you can continue developing your trading knowledge.
What the Risk-to-Reward Ratio Represents
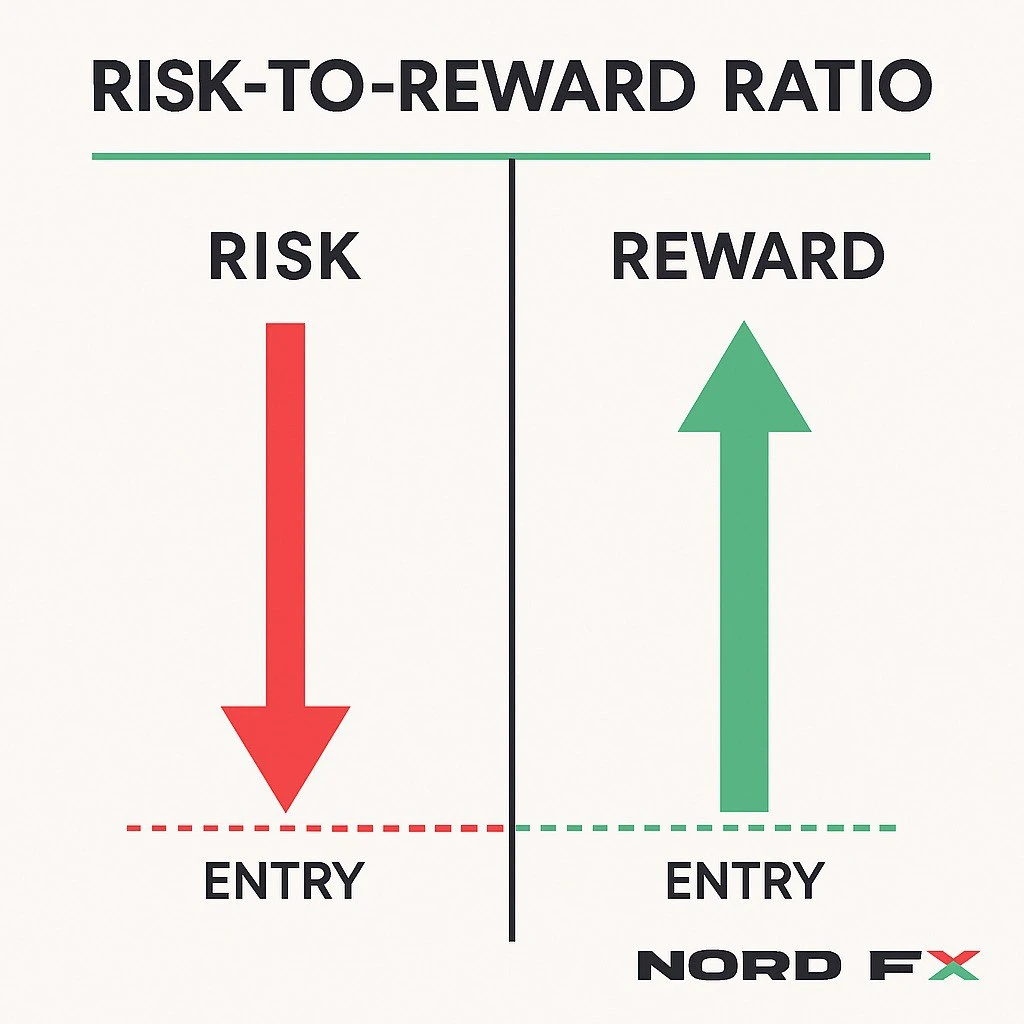
The risk-to-reward ratio expresses the relationship between potential loss and potential gain on any given trade. When planning a position, the trader identifies both the point where the idea becomes invalid and the point where the position should logically be closed for profit. The distance from the entry to the stop loss represents the risk. The distance from the entry to the take-profit level represents the reward.
A ratio of 1:1 means the trader risks the same amount they aim to gain. Ratios such as 1:2 or 1:3 indicate that the potential reward is two or three times larger than the potential loss. Regardless of whether the calculation is done in pips, points or currency value, the logic remains identical. A consistent approach is what matters.
How the Ratio Is Calculated
The formula is straightforward. It divides the monetary or pip-distance risk by the expected reward. For example, if a position risks 50 pips and aims for 100 pips, the ratio is 1:2. What makes this simple measurement powerful is that it directly influences a trader’s ability to remain profitable over a long series of trades.
If you need definitions of technical terms mentioned in this article, you may find the NordFX Glossary of key trading terms particularly useful.
Why the Ratio Matters: The Link With Profitability
A common misunderstanding is that traders must win most of their trades to succeed. The truth is different. A strategy with a high win rate can still lose money if the average loss is larger than the average gain. On the other hand, a trader with a modest win rate may remain consistently profitable by using favourable risk-to-reward ratios.
The relationship becomes clear when looking at trading expectancy. Expectancy measures the average amount a trader might gain or lose per trade when combining both wins and losses. If the average reward per winning trade is significantly larger than the average loss, the trader can withstand losing periods without damaging their account. The risk-to-reward ratio therefore supports emotional stability as well as mathematical consistency.
Examples of How the Ratio Works in Real Markets

Discussing ratios is theoretical until it is applied to real charts. The following examples from forex, indices and crypto show how traders calculate risk-to-reward in practice.
EUR/USD Example: A Classic 1:2 Structure
Imagine a trader buys EUR/USD at 1.1000 after a bullish rebound from support. The protective stop is placed at 1.0950, just below the structural swing low. The risk is therefore 50 pips. The target is placed at 1.1100, where the next resistance zone sits. The reward is 100 pips.
Risk equals 1.1000 minus 1.0950, which is 50 pips. Reward equals 1.1100 minus 1.1000, which is 100 pips. The risk-to-reward ratio becomes 1:2. Even if the trader wins only half their trades under similar conditions, such a structure creates room for net positive performance.
US100 Example: A Wider Position With a 1:3 Profile
A trader enters long on US100 at 18 000 after a breakout. The stop loss sits at 17 850, just under the breakout zone. The risk is 150 points. The target lies at 18 450, based on the next technical extension. The reward is 450 points.
Risk equals 18 000 minus 17 850, which is 150 points. Reward equals 18 450 minus 18 000, which is 450 points. Dividing risk by reward gives a 1:3 ratio. One well-executed trade can offset three losing trades of similar size, which adds resilience during volatile periods.
Bitcoin Example: A Short Position With a Clear 1:3 Structure
Suppose a trader anticipates a corrective move and shorts bitcoin at 90 000. The stop is at 92 000, above the recent swing high, creating a risk of 2 000. The target stands at 84 000, where the next major support cluster appears. The reward is 6 000.
Risk equals 92 000 minus 90 000, which is 2 000. Reward equals 90 000 minus 84 000, which is 6 000. The ratio is therefore 1:3. Crypto markets move quickly, so combining wide targets with controlled risk becomes important for managing volatility.
For traders who want to understand how risk behaves differently across exotic or less liquid pairs, the article How to Manage Currency-Pair Exposure: A Trader’s Guide to Less-Liquid and Exotic Forex Pairs provides valuable context.
Expectancy and the Balance Between Win Rate and Ratio
With these examples in mind, the connection between win rate and risk-to-reward becomes clearer. A trader who wins 45 percent of their trades can still grow their account if the average reward is roughly double the average loss. Meanwhile, someone who wins 60 percent of trades may still struggle if each loss outweighs each gain. Expectancy blends these two elements into a unified picture.
The most efficient trading habits develop when traders examine their performance through this lens. Journals that track the risk-to-reward of every trade reveal patterns. Some setups naturally produce higher ratios than others. Some rely on precision and tighter structures. Observing which combinations produce stable expectancy helps traders refine their strategy.
Choosing the Right Ratio for Different Trading Styles
Not every setup suits the same ratio. Markets move differently across time frames and traders approach risk in varied ways. The ratio should therefore fit the structure of the strategy rather than force an unnatural framework.
Short-Term Trading Dynamics
Scalpers working within narrow spreads often rely on smaller movements and tight stops. Their targets may be equally tight, creating lower ratios. Precision may compensate through higher win rates, although even here a slightly positive ratio helps absorb transaction costs.
Intraday and Swing Trading Conditions
Medium-term traders usually operate with targets broad enough to accommodate market noise. Ratios around 1:2 or 1:3 align well with daily market swings. The challenge lies in patience. Not every setup offers a favourable ratio and passing on low-quality opportunities becomes part of the plan.
Longer-Term Position Trading
Position traders may choose larger ratios when holding trades through extended trends. By managing risk with position sizing and realistic targets, they allow larger market cycles to generate meaningful reward.
Integrating Risk-to-Reward Into a Complete Trading Plan
To make the ratio a genuine part of trading rather than an afterthought, it must be incorporated into the planning stage. The typical sequence begins with identifying the structure of the setup. Once the trader determines where the idea becomes invalid, that point becomes the reference for the stop loss. The projected target must then justify the risk. If it does not, the trade is simply avoided rather than forced.
Position sizing completes the plan. Adjusting lot size based on stop-loss distance ensures that each trade risks a consistent proportion of the account. This provides stability across a large number of trades.
Challenges Traders Face When Applying the Ratio
Although the ratio is simple, real conditions introduce complications. Some traders force distant targets simply to achieve a theoretical ratio, despite the chart suggesting a more modest move. Others pay too little attention to their win rate or ignore transaction costs such as spreads and swaps, which can distort tight setups.
Awareness of these challenges improves decision-making and encourages a more realistic approach.
Conclusion
The risk-to-reward ratio offers a structured method for evaluating trading opportunities. By comparing potential loss with potential gain before entering a trade, traders introduce discipline into their decision-making process. The metric remains relevant across time frames, assets and market conditions. When combined with logical stop placement, realistic targets and thoughtful position sizing, it becomes a key component of long-term trading consistency.
Go Back Go Back
