17.12.17 is a landmark day in the modern cryptocurrencies history. It was then, last December 17, that having entered the American stock exchange, bitcoin, followed by all sorts of altcoins, stopped their flight to the cosmic heights and decided to land, together with their owners. To say that the crypto community was shocked is not to say anything! But the most terrible thing is that, despite all the prayers and incantations of investors, the world of digital prosperity is still continuing to crumble in front of them, burying their dreams of their own yachts, villas and islands. All the developments with cryptocurrencies in recent months look like an endless horror film, when rare frames of hope replace the scenes of the apocalypse, one of them more nightmarish than another.
The crypto community can be divided into three groups:
This material is addressed to the groups 2 and 3. Its goal is to show how it is possible not only to compensate for the losses incurred earlier, but also to obtain a very solid profit in the current ambiguous market. And all this is thanks to very simple methods of technical analysis.
Brokers who have come to the crypto-market, such as NordFX, have brought with them a vast toolkit that significantly increases the earning potential in almost any situation. And, first of all, this is the world most popular platform MetaTrader-4 (MT4) and its mobile applications. This is not a money-printing machine in any way, but in skilled hands, it becomes a great weapon for hunting both bulls and bears lurking in the digital jungle.
As an example, we will discuss a few simple methods of earning with the help of just a few indicators that are publicly available, some of which are already built into the MT4. (For those who are not familiar with this platform, you can get to know it on the NordFX website)..
It's no secret that the most important thing for profitable trading is define correctly when to open a position. Sell on the high, buy on the low: this is what all the textbooks say. But how to find these points of extremes? How one knows when the trend reverses?
It is well known that the overwhelming majority of trend indicators either give a lot of false signals with sensitive settings, or they lag if you remove this unnecessary "noise". If you pay attention to indicators pointing to support/resistance levels, they are more stable, and therefore can become one of the most reliable tools for crypto-trading. They can even be called leading indicators - after all, a trader can see online how the price is approaching this level. That is, he knows IN ADVANCE when a break in the trend may occur.
It is clear that the stronger the level, the higher the probability of a trend reversal. And you can determine this strength by looking at the history of quotations, how often the price bounced off a particular level in one or another direction. At the same time, in terms of cryptocurrencies, we recommend that you look for levels on timeframes not lower than H4, because of their high volatility. Most often we use the daily timeframe D1 together with the weekly W1 in our work.
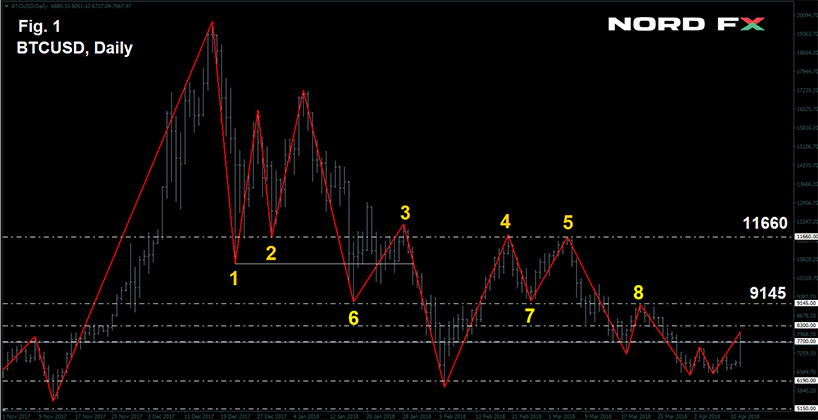
Fig.1
In Figure 1, for clarity, we put a ZigZag indicator on bitcoin quotations, and it is clearly seen thanks to it that the strongest are the levels 11,660 (break points of the trend 1, 2, 3, 4, 5) and 9,145 (points 6, 7, 8).
Moreover, it would be more correct to speak not of levels, but of support/resistance zones. The trader should not expect that the price will reverse exactly at the moment of touching, say, the level of 11,660. When the trend is strong and the market is relatively thin, it can pass a few hundred points by inertia, which is clearly visible at point 1. Such backlash is a common thing not only when trading cryptocurrencies, but also almost any other financial assets.
It happens quite often, that the price gets caught between two strong levels and moves between them for a long time, as if along a corridor. For bitcoin, it is the channel 9,145-11,660 mentioned above with Pivot Point 10,200, in the case its lower boundary is broken down, the price falls to the level below with the boundaries of 7,700-9,145. We can also see the lateral corridor 6,190-7,700 as an example.
And in case the pair BTC/USD continues falling (which is not excluded at all) it will be necessary to focus on the main channels of last summer-autumn, such as 5,350-6,190 and 3,560-4,470.
So, we just discussed how to build support/resistance levels using the ZigZag indicator. However, the tools developed for the MetaTrader-4 platform make it possible to use a few other indicators for this purpose, such as, say, the Price Channel (Fig. 2). If we connect the longest and most frequently encountered horizontal sections that are drawn by this indicator, we will get the same levels as in the first example. So, in principle, one of these indicators can be used as the main one, and the other one as the control indicator.
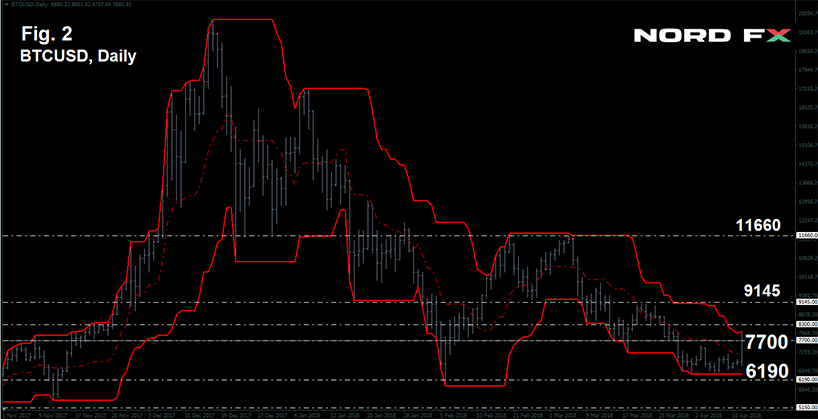
Fig. 2
Divergence may also serve as another powerful leading signal pointing to the trend reversal. To clarify, the divergence is the discrepancy between the directions of the crypto currency price change and the indications of the oscillators. Oscillators are a family of indicators, many of which are already built into the MetaTrader-4 platform. In our example, we will use one of the most famous and proven oscillators - MACD - on the four-hour timeframe H4.
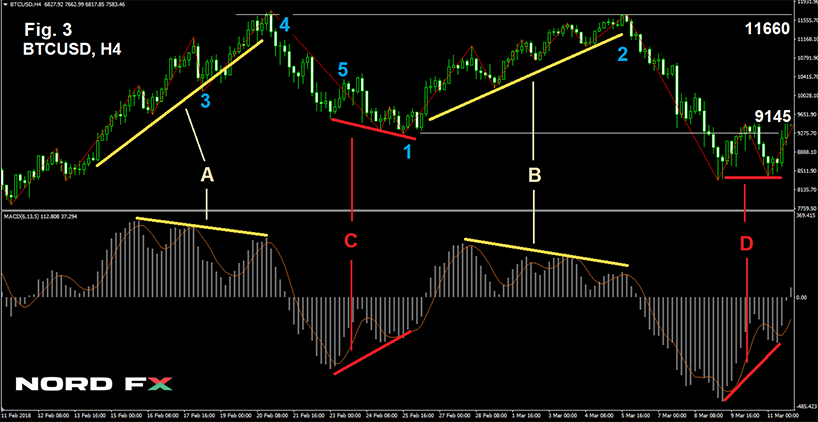
Fig. 3
In Fig. 3, the discrepancies between the bitcoin quotations (at the top of the figure) and the MACD indications (at the bottom) are very clearly visible. On segments A and B, despite the fact that the price continues to grow, the peaks on the indicator's graph are getting lower and lower. This is a strong signal that there will be a break in the trend soon and the price will go down, following the readings of the indicator.
We see the opposite picture in segments C and D, where the price either falls, or moves horizontally, and the MACD readings grow, which is a precursor to the growth of the bitcoin price.
Let's look at how bitcoin trading could be carried out in the period from February 11 to March 11, 2018. (Fig. 3.), as an example.
In order to draw trend lines, it is basically enough to connect two vertices, as on segments C and D, and the divergence of these lines, together with the approaching to the support level of 9.145, will be a good signal for the price reversal. At this point of time, the trader opens a position at point 1, with a volume of 1 lot, buying 1 BTC (in NordFX 1 lot is 1 bitcoin), which he sells at point 2 as the resistance level approaches 11,660, and profits $ 2,515 by doing so.
(It is natural that the spread or broker's commission will have to be deducted from this profit, but at NordFX they are minimal and are only about $ 55 for 1BTC).
And now let's look at another example - divergence A on the same chart.
As in the previous case, when the second peak is passed, the trader observes a divergence and opens a position for sale at point 3 at the price of 10,200.
(Unlike crypto-exchanges, such brokers as NordFX, allow you not only to buy, but also to sell cryptocurrency, even without having it. Such a transaction is called a CFD - a contract for the difference in prices, through which you can make a profit, even if the cryptocurrency collapses to zero).
So, the trader has sold 1 bitcoin, however, the price continues to move up, and by the time of approaching the level of 11,660 (point 4), he receives a loss of $ 1,460.
What has happened? Nothing special. When you are in the market, this happens often enough. And none of the signals gives a 100 percent guarantee of success.
What should one do? Option 1: close the position and, having fixed the loss, part with your money. And option 2: do not close anything, but, on the contrary, increase the position by several more lots.
The continuation of the divergence to the third peak (triple divergence) together with the approaching to the level of resistance at point 4 is a much stronger signal than at point 3. And this is why the trader at that moment decides to open one more position to sell, with a volume of 1.5 lots.
Thus, the trader has two positions: the first one which has volume of 1 lot, opened at a price of BTC 10,200, and the second one, with the volume of 1.5 lots, opened at 11,660. He closes both these positions, following the MACD signal, at point 5 at a price of 10,650. As a result, he will receive a loss of $ 450 for the first transaction, and a profit of $ 1,515 for the second one. The total revenue from this series of two transactions will be $ 1,065.
It should be noted that the divergence can be not only double (C and D) or triple (A), but also, for example, fourfold, as on segment B (Fig. 3). And then you have to increase the position not one, but two times. And there are cases when there are three, four, and more times... But all this needs money. And how to ensure that you have enough money? The answer is: use Money Management and leverage.
Money Management is a method of managing funds, which includes, and this is the most important thing, - pre-calculated risks for each transaction separately and for a series of transactions together.
Leverage is the amount of credit that is automatically and without any collateral provided by the broker to a trader for making transactions on the market. Thus, if the maximum leverage ratio is 1:1000, as NordFX has it, if the trader has $1000 in his account, the trader can carry out transactions for the purchase/sale of cryptocurrencies or other financial instruments for an amount 1,000 times greater than his own funds, that is, $1,000,000. But it is not necessary and not required to use all this potential at once. The main benefit of the leverage ratio is that it provides the trader with additional freedom of movement. The higher the leverage ratio is, the more available funds you have.
We should say straight away that the amount of leverage does not affect the level of risk. The trader manages the risk when opening a position of this or that volume. And do not listen to anyone who says the opposite. This may mean only one thing - this person has no idea about Money Management.
In order to open a position with the volume of 1 lot at a price of $10,000, you need exactly the same amount of money, that is, $10,000. (Even a little more, considering the spread). With a 1:1000 leverage ratio, you can open the same position with only $10, and the remaining $9,900 can be used to withstand the drawdown of many thousands (current loss) in case the price goes against you, and to open one or more new positions, as described in the example above.
One of the most famous professional traders today, Larry Williams, initially based on the maximum acceptable risk per transaction of 5 percent of his deposit in his trading, later he limited it to 2 or maximum 3 percent. Williams traded futures on bonds and the S&P 500 index, whose volatility is significantly lower than the volatility of cryptocurrencies, and this must be considered when developing your own rules for Money Management.
It goes without saying that experienced traders use much more complex and profitable strategies in their work than the one described above. But we do not insist that ours is the best. Our task has been completely different: to show to those who are tired of waiting for the next bitcoin take-off, how one can profit now, regardless of whether cryptocurrencies are growing or are sweeping to the bottom.
Isn't it time to stop being passive contemplatives, ladies and gentlemen? After all, one can wait for the grass to grow for endless time. Isn't it time to move on, to become an active trader and use all the rich toolkit and all the opportunities that are provided to you by such brokers as NordFX? Yes, at first it will be difficult. But, as the ancient Romans said, Viam supervadet vadens - the road will be mastered by the going.
Good luck!


