What is an inverse cup and handle pattern?
Short answer: An inverse cup and handle is a bearish chart pattern formed by a rounded top followed by a smaller upward retracement called the handle. The pattern is typically confirmed when price breaks below the support level at the base of the formation, indicating that selling pressure may be gaining strength.
What is the inverse cup and handle pattern, and what does it tell traders? It is a bearish chart formation that can signal weakening buying pressure and a possible continuation or reversal lower when price breaks below a defined support level. The pattern becomes more useful when its structure, breakout, market context, and risk controls all align.
The inverse cup and handle is essentially the bearish counterpart of the traditional cup and handle. Instead of forming a rounded bottom followed by a small pullback, price creates a rounded top and then a modest upward retracement before attempting to break support. Traders generally wait for confirmation rather than treating the shape alone as a sell signal.
Key takeaways:
- The inverse cup and handle is primarily a bearish price pattern.
- A rounded top forms the cup, while a smaller upward retracement creates the handle.
- The pattern is normally confirmed only after price breaks below support.
- Traders can estimate a potential target using the depth of the cup, but the target is not guaranteed.
- Market context, volume, momentum, stop placement, and position sizing can be as important as the pattern itself.
Inverted Cup and Handle Pattern Definition
The inverted cup and handle pattern, also called the inverse cup and handle, is a bearish technical analysis formation consisting of a rounded price peak followed by a smaller upward consolidation. It suggests that buyers have progressively lost control while sellers are gaining enough strength to challenge an important support area.
The pattern usually develops in two stages.
First, price rises gradually, reaches a broad peak, and then declines. This creates the inverted cup. Rather than producing a sharp V-shaped reversal, the price movement normally looks rounded, showing a gradual transition from buying pressure to selling pressure.
Second, price rebounds after reaching the lower edge of the cup. This recovery creates the handle. The handle should generally be smaller than the cup and should not rise substantially above the cup's highest point.
The lower area connecting the two sides of the cup acts as an important support or neckline zone. A breakdown below this level provides the main confirmation traders look for.
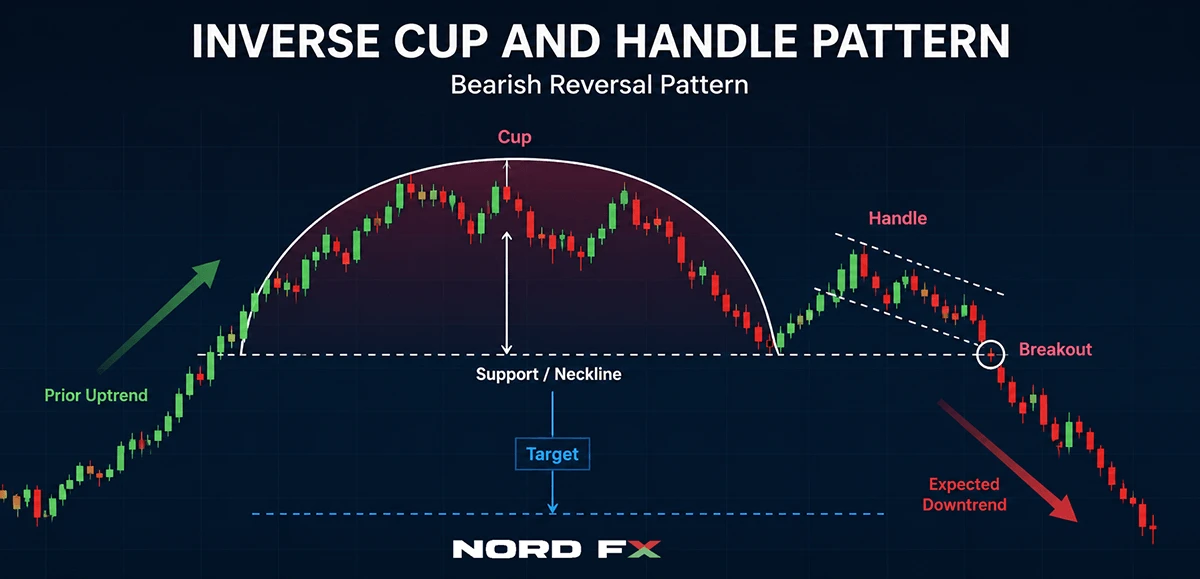
Price-action logic behind the structure
The pattern matters because of how supply and demand change throughout its formation.
Imagine an asset rising from 90 to approximately 110. Instead of continuing directly upward, momentum slows near 110. Price then gradually falls toward 90.
Buyers attempt another recovery, perhaps pushing price from 90 to 96. However, they cannot restore the earlier bullish trend. If price subsequently falls through 90, traders may interpret the failed recovery as evidence that sellers have taken control.
The important signal is therefore not simply the rounded shape. It is the combination of weakening upward momentum, a failed recovery, and a confirmed support break.
Inverse cup and handle vs similar patterns
Several formations can resemble an inverse cup and handle. The differences become clearer when their structure and confirmation rules are compared.
Pattern | Main structure | Typical bias | Key confirmation |
Inverse cup and handle | Rounded top plus smaller upward handle | Bearish | Break below cup support |
Regular cup and handle | Rounded bottom plus smaller downward handle | Bullish | Break above resistance |
Head and shoulders | Three peaks with central higher peak | Bearish | Break below neckline |
Rounding top | Gradual rounded peak without clear handle | Bearish | Support breakdown or continued lower structure |
A pattern without a recognisable handle may be better classified as a rounding top rather than an inverse cup and handle.
How to Identify and Confirm the Inverse Cup and Handle
To identify an inverse cup and handle, look for a rounded top followed by a smaller upward retracement and then monitor the lower support boundary for a bearish breakout. Confirmation normally requires price to close below this support rather than merely touching or briefly crossing it.
Step 1: Find the rounded cup
The inverted cup should show a gradual change in market direction.
Price initially rises, slows near the top, and then begins falling. A smooth curve is preferable to a pattern dominated by sudden price spikes because the rounded structure better represents a gradual shift in momentum.
The two lower edges of the cup do not need to occur at exactly the same price. Chart patterns are zones rather than mathematically perfect shapes.
Step 2: Identify the handle
After reaching the lower right side of the cup, price should recover or consolidate upward.
This move represents a temporary attempt by buyers to regain control. Ideally, the handle remains relatively shallow compared with the entire cup.
If the recovery returns to the top of the cup or breaks strongly above it, the bearish interpretation becomes weaker.
Step 3: Mark support
Draw a horizontal or slightly angled support zone across the lower boundary of the cup.
This level is important because both the cup and handle interact with it. A decisive break below the area suggests that buyers defending support are no longer able to absorb selling pressure.
Step 4: Wait for confirmation
A common confirmation method is a candle close below support.
Some traders also examine volume or momentum. For example, an increase in trading activity during the breakdown can add weight to the signal. Momentum indicators showing weakening bullish momentum may provide additional context, although no indicator can confirm a trade with certainty.
When the pattern is a good fit
The setup tends to be easier to interpret when:
- the cup is clearly rounded;
- the handle is noticeably smaller than the cup;
- support can be identified without forcing the chart;
- the breakout is decisive;
- the broader market structure supports a bearish move.
When it may not be a good fit
A trader may avoid classifying the structure as an inverse cup and handle when price is extremely erratic, the supposed handle is almost as large as the cup, support is unclear, or the pattern becomes visible only after repeatedly adjusting trend lines.
A chart pattern should help simplify price behaviour. If identifying it requires too many assumptions, its practical value decreases.
Market Psychology Behind the Pattern
The market psychology behind the inverse cup and handle reflects a gradual transition from buyer control to seller control.
During the left side of the cup, buyers are still pushing the market higher. However, the rate of advance starts slowing as price approaches the top of the formation.
At the rounded peak, buying pressure is no longer strong enough to maintain the previous rate of appreciation. Sellers become increasingly active, while some existing buyers may begin closing profitable positions.
Price then declines along the right side of the cup.
When it reaches support, buyers attempt to recover. This produces the handle. The rebound can attract traders who believe the previous bullish movement is about to resume.
However, the recovery is weaker than the original advance. If buyers cannot push price significantly higher, sellers may re-enter.
A break below support changes the balance further. Traders who bought during the handle may exit losing positions, while bearish traders may initiate new positions. Both actions can contribute to downward pressure.
This explains why the handle is important. It tests whether buyers can regain control after the rounded top.
The pattern should still be interpreted in context. A bearish formation appearing directly above major long-term support may behave differently from the same pattern developing inside a strong established downtrend.
How to Trade the Inverse Cup and Handle Pattern
A common way to trade the inverse cup and handle is to wait for a confirmed support breakdown, define the invalidation level, estimate a possible downside objective, and calculate position size before entering. Traders may use either a breakout entry or a more conservative retest entry.
Breakout entry
The simplest approach is to enter after price closes below the pattern's support zone.
Suppose an inverse cup forms with support near 100 and a peak near 120. The handle rebounds to 108 before price falls again.
If price closes below 100, a trader may consider that the bearish confirmation.
Entering before the breakdown provides an earlier entry price but also creates greater risk that the support level will hold and the pattern will fail.
Breakout-and-retest entry
A more conservative trader may wait for price to break below support and then return toward the broken level.
For example:
Price breaks from 100 to 97.
It later rebounds to around 99–100.
The former support now acts as resistance.
Price begins moving lower again.
The trader may enter after seeing evidence that the retest has failed.
The advantage is additional confirmation. The disadvantage is that a retest does not always occur, so some trades may move lower without providing an entry.
Inverse cup and handle price target
A commonly used target calculation measures the approximate depth of the cup and projects that distance below the breakout level.
Using the previous example:
Cup high: 120
Support: 100
Cup depth: 20
Breakout level: 100
Estimated target: 100 - 20 = 80
This calculation gives a theoretical objective near 80.
It should not be treated as a guaranteed destination. Nearby support zones, volatility, market conditions, and changes in momentum may justify taking profits earlier or managing the position dynamically.
Stop-loss logic
A stop should be placed where the original trade idea becomes invalid rather than at an arbitrary distance.
One possibility is above the handle high. If the handle peaks near 108, a trader entering below 100 may consider a stop above 108, depending on volatility and strategy rules.
Another approach is to place the stop above a nearby resistance level after a breakout and retest.
A wider stop generally requires a smaller position to maintain the same monetary risk.
For example, if a trader is prepared to risk $100 and the distance between entry and stop represents $2 per unit, the maximum position under that risk rule would be 50 units.
Risk control is necessary because even well-formed inverse cup and handle patterns can fail.
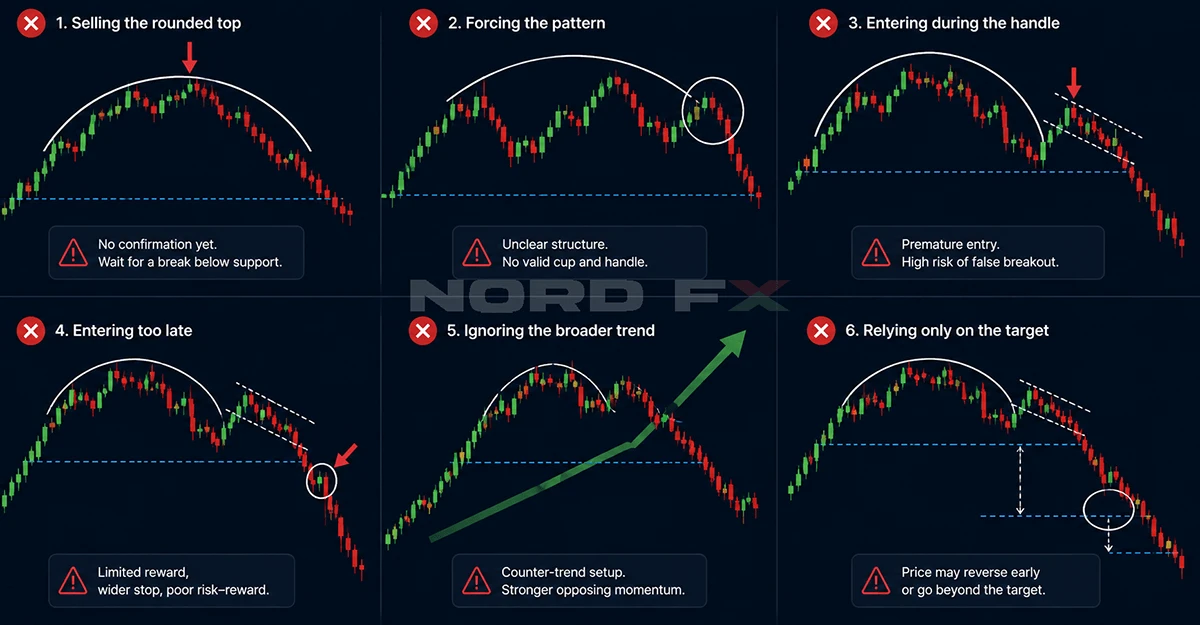
Common Errors
One of the most common errors is selling simply because a rounded top appears. The inverse cup and handle is not fully confirmed until the market demonstrates weakness around the lower support boundary.
Another mistake is forcing the pattern onto almost any bearish chart.
Real patterns rarely look perfect, but the main components should still be recognisable. If the cup is not rounded, the handle is excessively large, or no meaningful support level exists, the setup may be something else.
Entering during the handle is another aggressive approach that can produce false signals. At that stage, price is still moving higher, and buyers may continue pushing the market beyond the expected handle area.
Traders can also make the opposite mistake by entering too late. After a substantial decline below support, the potential reward may shrink while the required stop remains relatively distant.
Ignoring the broader trend is another risk. A bearish pattern forming within a strongly bullish market can still work, but it may face stronger opposing momentum.
Finally, relying entirely on the theoretical price target can lead to poor trade management. The measured objective provides a reference point, not a promise. Price may reverse at an earlier support level or move substantially beyond the calculated target.
Advantages and Limitations
The inverse cup and handle can be useful because it combines trend deterioration, a failed recovery, and a support breakout into a single visual framework. However, its interpretation remains subjective, and false breakouts are possible.
Advantages
The formation provides relatively clear structural levels. Traders can usually identify a support area, handle high, breakout level, and potential invalidation point.
It also offers a logical method for estimating a possible price objective using the depth of the cup.
Another advantage is flexibility. The pattern can appear across gold, stock indices, commodities, cryptocurrencies, and other actively traded markets. It can also form on different timeframes.
The pattern encourages confirmation-based trading rather than prediction. A trader can wait for price to demonstrate that sellers have broken support before considering an entry.
Limitations and objections
The biggest limitation is subjectivity. Two traders can examine the same chart and disagree about whether the curve is sufficiently rounded or whether the handle is valid.
False breakouts are another concern. Price may move below support temporarily and then recover sharply above it.
The measured target can also create false precision. Market prices do not move according to fixed geometric formulas, so a 20-point cup does not guarantee a 20-point decline after the breakout.
Another objection is that chart patterns can become obvious only in hindsight. Traders can reduce this problem by defining rules before entering: where the cup begins, what qualifies as a handle, what confirms the breakout, and where the setup becomes invalid.
The inverse cup and handle is therefore best treated as a framework for organising price action rather than a standalone prediction tool.
FAQ
Is the inverse cup and handle bullish or bearish?
The inverse cup and handle is generally considered a bearish pattern. It shows a rounded top followed by a smaller recovery before price tests support. The bearish signal becomes stronger if price breaks and closes below that support zone.
What confirms an inverse cup and handle pattern?
A break below the support level connecting the lower portions of the formation is the main confirmation. Many traders prefer to see a candle close beneath support rather than reacting to a brief intraday move. Volume, momentum, and a failed retest of broken support can provide additional confirmation.
How do you calculate an inverse cup and handle target?
Measure the approximate vertical distance between the cup's highest point and its support level. Then subtract that distance from the breakout price. If the cup is 20 points deep and support breaks at 100, the theoretical target would be approximately 80. This remains an estimate rather than a guaranteed price objective.
What invalidates an inverse cup and handle?
The setup becomes weaker if price fails to break support or rises strongly through the handle and back toward the cup high. After a confirmed bearish breakout, a sustained move back above the broken support area may also question the setup. The exact invalidation rule depends on the trader's entry method and risk plan.
What is the difference between an inverse cup and handle and a head and shoulders pattern?
Both patterns can signal bearish conditions, but their shapes differ. A head and shoulders pattern contains three distinct peaks, with the middle peak normally highest. An inverse cup and handle has one broader rounded peak followed by a smaller upward retracement. Both generally require a support or neckline break for confirmation.
Can the inverse cup and handle pattern fail?
Yes. Price can break below support and then reverse higher, producing a false breakout. The rounded structure can also develop into a larger consolidation rather than a sustained bearish move. Stop-loss planning and appropriate position sizing are therefore important even when the pattern appears well formed.
Which timeframe is best for an inverse cup and handle?
There is no single best timeframe. The formation can appear on intraday, daily, weekly, and other charts. Higher timeframes may contain more market information and produce larger price structures, while shorter timeframes may generate more signals and more market noise. Traders should use a timeframe that fits their trading horizon and risk-management approach.
Revenir en arrière Revenir en arrière