The Xmaster Formula Indicator has become a go-to tool for many traders seeking clear, actionable signals in a fast-moving market. Built for the MetaTrader platforms (MT4 and MT5), this custom indicator is praised for its simplicity, visual clarity, and ability to detect potential trend reversals and continuations with minimal lag. Whether you're a beginner or a seasoned trader, understanding how to effectively use the Xmaster Formula Indicator can enhance your technical analysis and improve decision-making. In this comprehensive guide, we’ll explore how the indicator works, how to trade with it, and how to combine it with other tools for optimal results.
Table of Contents
What Is the Xmaster Formula Indicator in Forex?
How To Install and Remove This Forex Indicator in MT4?
Advantages of Xmaster Formula Indicator
Disadvantages of Xmaster Formula Indicator
Xmaster Formula Indicator Strategy
Key Takeaways
- User-Friendly: Provides clear buy and sell signals with green and red arrows.
- No-Repaint: Signals remain fixed once generated, ensuring consistency.
- Versatile: Applicable across various timeframes and financial instruments.
- Combination Tool: Integrates multiple indicators like EMA, MACD, RSI, Parabolic SAR, and Stochastic Oscillator.
🔗 what
What Is the Xmaster Formula Indicator in Forex?
The Xmaster Formula Indicator is a specially developed technical analysis tool intended for use on the MetaTrader 4 and MetaTrader 5 platforms. Unlike standard indicators that rely on a single formula or data set, this tool integrates multiple widely used technical indicators to produce a simplified and visually intuitive signal system. It blends the strengths of several well-established tools—including Exponential Moving Averages (EMA), Moving Average Convergence Divergence (MACD), Relative Strength Index (RSI), Parabolic SAR, and the Stochastic Oscillator—into a single, cohesive framework.
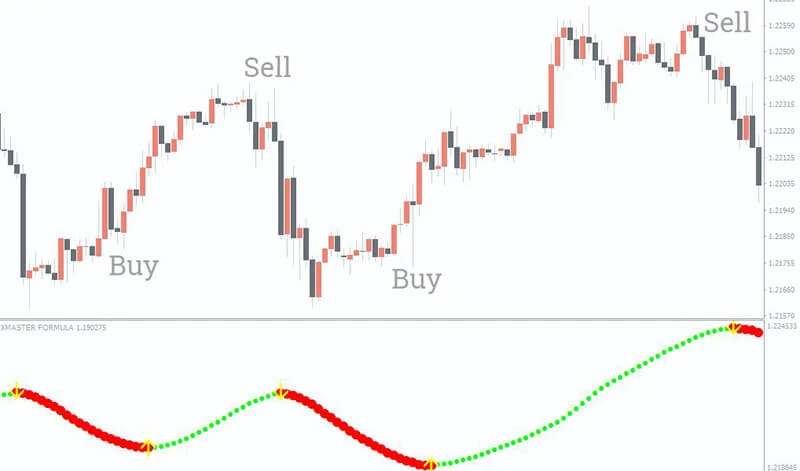
Each of these components serves a different analytical purpose: EMAs highlight trend direction, MACD captures momentum shifts, RSI and Stochastic assess overbought or oversold conditions, and Parabolic SAR focuses on identifying potential trend reversals. The Xmaster Formula processes all this data in the background and converts it into easy-to-read visual signals on the chart. When a potential buying opportunity is identified, a green arrow appears, typically below the price action. Conversely, a red arrow above the candles indicates a potential selling opportunity.
This setup helps reduce the complexity that often comes with monitoring multiple indicators separately. It streamlines the analytical process for traders who prefer a cleaner chart while still benefiting from a multi-layered decision-making approach. The indicator can be especially helpful during periods of increased market activity, offering traders timely cues to act on emerging trends.
🔗 how
How It Works
The Xmaster Formula Indicator functions by aggregating and interpreting data from several widely recognized technical analysis tools. It continuously processes market inputs such as price movements, momentum changes, and volatility levels. These inputs are filtered through internal algorithms that combine outputs from indicators like EMA, MACD, RSI, Parabolic SAR, and the Stochastic Oscillator.
When specific market conditions align—such as a synchronized signal from MACD showing momentum, RSI indicating a favorable level, and EMA confirming trend direction—the indicator responds by displaying a visual signal on the chart. These visual cues are designed to alert traders to potential market entry or exit points without requiring them to interpret multiple data layers manually.
A green arrow appears beneath the candlestick when the system detects conditions favorable for buying. This suggests a possible start of an upward price movement. On the other hand, a red arrow shows up above the candle when the system identifies conditions suitable for selling, typically indicating a downward shift in price.
This approach not only saves time but also helps reduce confusion by consolidating multiple signals into one easily interpreted output, allowing traders to focus more on decision-making than analysis.
Key Points
- No-Repaint Signals
Signals remain visible on the chart once they are triggered. This means that the indicator does not change or erase them after market conditions shift, providing traders with consistent reference points for backtesting and real-time evaluation.
- User-Friendly Interface
The interface is simple and clear. Even those who are new to Forex trading can understand the signals with minimal explanation. The color-coded arrows are immediately visible and easy to interpret.
- Multi-Timeframe Compatibility
The Xmaster Formula can be applied across various chart timeframes. It performs particularly well on the H1, H4, and D1 intervals, which are preferred by swing and position traders. However, it can also be adapted for shorter timeframes by scalpers with appropriate risk controls.
- Versatility Across Assets
While originally popular among Forex traders, the indicator is not limited to currency pairs. It can also be used effectively in other markets such as commodities, cryptocurrencies, and indices, offering flexibility for multi-asset traders.
Buy Signal
The original version of the Xmaster Formula Indicator limits user access to its internal settings and source code, which means traders need to follow visual prompts rather than customizing the tool. Despite this, there are some clear patterns and guidelines that help in interpreting the buy signals:
- When two downward-pointing arrows appear at once, it can indicate a price level that is potentially oversold and preparing to reverse upward.
- If a strong bearish candle forms while the signal appears, it could indicate market exhaustion, paving the way for a bullish reversal.
- A protective stop-loss should be placed just above the highest point of the candle that triggered the signal. This helps limit losses if the signal turns out to be false.
- If the arrow shifts to yellow, it may indicate a weakening signal. At that point, traders should either lock in profits or watch for price reaction at key support or resistance levels before making further decisions.
Sell Signal
Like the buy signals, sell signals rely on straightforward visual indications supported by pattern recognition:
- A green indicator line or arrow during a rising market trend may suggest that a peak is forming and a reversal is likely.
- If the arrow points upward at the same time the indicator line changes color, the system may be signaling an ideal moment to open a short position.
- A sell signal is further confirmed if a strong bullish candle forms, especially after a prolonged uptrend. This can signal buyer exhaustion.
- The stop-loss for sell trades should be placed just below the candle’s lowest point that initiated the trade, helping to limit downside risk.
- If the red arrow persists or the signal line turns red while pointing downward, the bearish momentum may be strengthening. This could be used as a trailing signal to extend profits or scale into a position.
Together, these conditions provide a structured way to interpret market movements, enabling both discretionary and rules-based traders to execute with more clarity and confidence. While the indicator alone is powerful, using it with complementary tools enhances reliability and reduces the risk of false entries.
🔗 info
Recommendations & Information
The Xmaster Formula Indicator offers a simple and visually intuitive way to approach market analysis, making it accessible even for traders who are relatively new to technical indicators. Because it reduces the need to monitor multiple charts and parameters at once, it serves as a helpful tool for streamlining decision-making. However, relying on it as the sole basis for trading decisions is not advisable.
Although the indicator delivers clear signals for buying and selling, these signals are derived from internal algorithms based on conventional tools like MACD, RSI, and moving averages. As with any signal-based tool, there’s always a risk of misinterpretation, particularly during choppy or range-bound markets. For this reason, using additional confirmation tools can greatly improve the quality of trading setups.
A common practice is to pair the Xmaster Formula with Bollinger Bands. This allows traders to identify volatility and price boundaries more precisely. For instance, if a buy signal appears near the lower band, the likelihood of a short-term price rebound increases. On the other hand, if a sell signal aligns with the upper band, it could confirm an overbought condition.
Another useful companion tool is the Fibonacci retracement indicator. When the Xmaster Formula issues a signal near a key Fibonacci level—such as the 61.8% or 38.2% retracement zone—it adds further weight to the trade setup. This can help determine not just the direction of the move, but also potential entry and exit points.
Time of day also plays a role. The indicator functions reliably during periods of higher market activity, such as the London and New York sessions. These windows often see stronger momentum and higher volume, both of which contribute to more decisive and clearer price action. During quieter sessions, such as the Asian session, signals may appear less frequently or may not result in strong follow-through.
For risk-conscious traders, it's recommended to test the indicator in a demo environment before applying it to live trades. Observing its behavior in different market conditions will help users understand its strengths and limitations. Incorporating basic money management techniques—such as predefined stop-loss and take-profit levels—can further mitigate risk and improve long-term results.
Finally, adjusting the lot size in accordance with account balance and volatility conditions ensures more sustainable trading. While the Xmaster Formula Indicator simplifies entry and exit decisions, disciplined execution and a well-rounded trading plan remain essential for consistent success.
🔗 Install
How To Install and Remove This Forex Indicator in MT4?
Installation Steps:
- Download: Obtain the Xmaster Formula Indicator file from a reputable source.
- Open MT4: Launch your MetaTrader 4 platform.
- Access Data Folder: Navigate to File > Open Data Folder.
- Install Indicator: Place the downloaded .ex4 or .mq4 file into the MQL4 > Indicators folder.
- Restart MT4: Close and reopen the platform.
- Apply Indicator: Go to Navigator > Indicators, find Xmaster Formula, and drag it onto your chart.
Removal Steps:
- Open MT4: Launch your MetaTrader 4 platform.
- Access Data Folder: Navigate to File > Open Data Folder.
- Locate Indicator: Go to MQL4 > Indicators folder.
- Delete File: Remove the Xmaster Formula Indicator file.
- Restart MT4: Close and reopen the platform to complete the removal.
🔗 Tool
Confirmation Tool
One of the key strengths of the Xmaster Formula Indicator lies in its ability to serve as a secondary confirmation tool in a multi-indicator trading strategy. While it can generate standalone signals, its reliability significantly improves when cross-validated with other widely used technical indicators.
For example, the Relative Strength Index (RSI) is commonly used to determine whether an asset is overbought or oversold. By pairing the Xmaster Formula with RSI, traders can filter out weaker signals and focus only on those backed by clear momentum or reversal cues. Suppose the Xmaster Formula generates a sell signal, and the RSI is simultaneously showing a value above 70—an area typically associated with overbought conditions. This alignment increases the probability that a downward price correction is imminent, making the trade setup more convincing.
Similarly, the Moving Average Convergence Divergence (MACD) is useful for identifying changes in trend strength and direction. When the MACD histogram or crossover confirms the same signal provided by the Xmaster Formula—such as a bullish crossover occurring shortly after a green buy arrow—it helps to validate the momentum behind the move. This layered confirmation gives traders more confidence to act on the signal rather than second-guessing their entry.
Another example involves using the Xmaster Formula in conjunction with candlestick patterns. If the indicator issues a sell signal and this coincides with the appearance of a reversal candlestick pattern like a shooting star or bearish engulfing candle, it creates a stronger justification for opening a short position.
Support and resistance levels can also be used to reinforce Xmaster Formula signals. If a buy signal appears just as the price bounces from a well-tested support level, or a sell signal forms near a known resistance zone, it suggests that the market is respecting these key areas, which may lead to a more substantial move.
In highly volatile market environments, confirmation becomes even more critical. The Xmaster Formula can occasionally produce false signals during sharp price swings or news-driven movements. In such cases, confirming the signal with volume-based tools, such as the On-Balance Volume (OBV) or Volume Profile, can help determine whether a breakout or reversal has sufficient backing.
Overall, using the Xmaster Formula as a confirmation tool allows for greater flexibility and precision in trading. It encourages a more thoughtful and structured approach to entering the market, helping reduce reliance on instinct or single-source indicators. When combined with sound analysis and proper timing, the confirmation it provides can significantly improve the quality and outcome of trades.
Overbought Trading
Overbought conditions suggest that an asset may be trading at a price higher than its intrinsic value, often leading to a price correction. The Xmaster Formula Indicator can help identify these conditions by analyzing price movements and signaling potential reversals. Traders should look for confirmation from other indicators, such as the RSI, to validate these signals.
Oversold Trading
Conversely, oversold conditions indicate that an asset may be undervalued, presenting potential buying opportunities. The Xmaster Formula Indicator can detect these scenarios by highlighting significant price declines that may precede a reversal. Again, corroborating these signals with tools like the RSI can enhance decision-making.
🔗 Advantages
Advantages of Xmaster Formula Indicator
The Xmaster Formula Indicator offers a number of practical benefits that make it attractive to a wide range of traders, from beginners to those with advanced experience. Its strength lies in its balance between simplicity and the depth of analysis it performs behind the scenes. Here are the core advantages that contribute to its popularity in the trading community:
User-Friendly Interface
One of the standout features of this indicator is its ease of use. The visual design is straightforward, with color-coded arrows providing immediate cues for potential buy or sell opportunities. This makes it accessible for traders who may not yet be comfortable interpreting complex chart setups or using multiple indicators at once. The indicator condenses a broad range of data into a simple format that can be understood at a glance.
No-Repaint Signals
Once a signal is issued—whether it's a green arrow indicating a buying opportunity or a red arrow suggesting a possible sell—it stays fixed on the chart. This is particularly valuable for backtesting strategies or analyzing past performance. Unlike repainting indicators, which change their signals as new data emerges, the Xmaster Formula provides a consistent historical reference. This stability makes it easier to evaluate the accuracy and performance of previous signals.
Versatility Across Markets and Timeframes
The indicator performs well across a variety of asset classes. While it is primarily used in Forex trading, it can also be applied to indices, commodities, and cryptocurrencies. Additionally, it is effective across multiple timeframes. Whether a trader is focused on short-term scalping using 5-minute or 15-minute charts, or prefers longer-term trades on the H1, H4, or daily timeframes, the Xmaster Formula can adapt to suit different trading styles and strategies.
Integration Capability with Other Tools
Another key benefit is how easily the indicator integrates with other technical tools. It complements common indicators such as RSI, MACD, Bollinger Bands, and Fibonacci retracement levels. Traders often use it as a base signal and then confirm or refine that signal using additional methods. This multi-indicator approach reduces the chances of acting on false signals and improves overall decision-making by adding layers of confirmation.
🔗 Disadvantages
Disadvantages of Xmaster Formula Indicator
While the Xmaster Formula Indicator is valued for its simplicity and ease of use, it’s important to understand its limitations. Like all technical indicators, it has certain drawbacks that can affect its reliability, especially in specific market conditions or when used improperly. Below are key disadvantages traders should keep in mind:
Lagging Nature
Because the Xmaster Formula Indicator is built upon multiple traditional indicators like EMA, MACD, and RSI—which are themselves lagging in nature—it often reacts to market changes after they have already occurred. This means that the signals it produces may appear late, after a significant portion of a price move has already unfolded. As a result, traders might enter a position when the trend is already well underway, reducing potential profit margins or increasing exposure to a reversal.
False Signals in Low Volatility Conditions
The indicator tends to perform best in markets with strong directional movement. During periods of low volatility or when price moves sideways within a narrow range, the Xmaster Formula may generate misleading signals. In these environments, the market often lacks enough momentum to follow through on buy or sell setups, leading to whipsaws or premature entries. Traders may find themselves opening positions that quickly reverse or fail to develop altogether.
Reliance on Complementary Tools
One of the more critical considerations is that the Xmaster Formula Indicator is not designed to serve as a complete trading system. It does not provide detailed insights into trend strength, market volume, or macroeconomic influences. Relying solely on the arrows it generates can lead to poor trading decisions, especially in unpredictable markets. To improve its effectiveness, it should be paired with other analysis tools such as support and resistance levels, volume indicators, or trend confirmation techniques. This layered approach helps to validate signals and minimize unnecessary risk.
🔗 Formula
Xmaster Formula Indicator Strategy
An effective strategy involves using the Xmaster Formula Indicator in conjunction with other technical tools to confirm signals. For instance, a trader might wait for a green arrow (buy signal) from the Xmaster Formula and then seek confirmation from the RSI indicating an oversold condition. This multi-indicator approach can improve the reliability of trading decisions.
Overbought and Oversold Detection in the Xmaster Formula Indicator
The Xmaster Formula Indicator can help detect overbought and oversold market conditions, which are critical for identifying potential reversal points. By analyzing price movements and momentum, the indicator provides visual cues—such as color changes or arrows—that signal these conditions. Traders should use these signals in conjunction with other indicators to validate potential entry or exit points.
The Bottom Line
The Xmaster Formula Indicator is a versatile tool that, when used appropriately, can enhance trading strategies. Its effectiveness is maximized when combined with other technical indicators and sound risk management practices. Traders should remain cautious of its limitations and avoid relying solely on its signals for decision-making.
🔗 FAQ
Frequently Asked Questions
Q1: Can the Xmaster Formula Indicator be used for all currency pairs?
Yes, the indicator is versatile and can be applied to major, minor, and exotic currency pairs.
Q2: Is the Xmaster Formula Indicator suitable for beginners?
Absolutely. Its user-friendly interface makes it accessible for traders at all levels.
Q3: Does the indicator work on all timeframes?
Yes, it is effective across various timeframes, including H1, H4, and D1.
Q4: Should I use the Xmaster Formula Indicator alone?
While it provides valuable signals, it's recommended to use it alongside other technical indicators for better accuracy.
Disclaimer: These materials are not an investment recommendation or a guide for working on financial markets and are for informational purposes only. Trading on financial markets is risky and can lead to a complete loss of deposited funds.
Kembali Kembali
