Technical analysis trends refer to the general direction of market price movement over time. The three main types are uptrends, downtrends, and sideways trends. Traders use trend analysis to identify momentum, market structure, and potential trading opportunities.
Technical analysis trends show the direction of price movement in a market over time. A trend can move upward, downward, or sideways, and traders use it to understand whether buyers or sellers are in control. The most common tools for spotting trends are trendlines, moving averages, support and resistance, and price structure. For beginners, trend analysis is one of the most useful parts of technical analysis because it helps turn price charts into clearer trading decisions.
What Is a Trend in Technical Analysis?
A trend is the overall direction of price movement over a period of time. In an uptrend, price generally makes higher highs and higher lows. In a downtrend, price usually makes lower highs and lower lows. In a sideways trend, price moves inside a range without a clear direction. Traders study trends because markets often continue in the same direction longer than expected.
Why Trends Matter
Trends matter because they help traders follow momentum instead of guessing reversals. When a market is trending, trading with that direction is often simpler than trying to predict turning points. Trend analysis also helps traders choose entries, exits, and risk levels more consistently. For beginners, this makes trends one of the most practical foundations in technical analysis.
What Are the Main Types of Trends?
There are three main trend types:
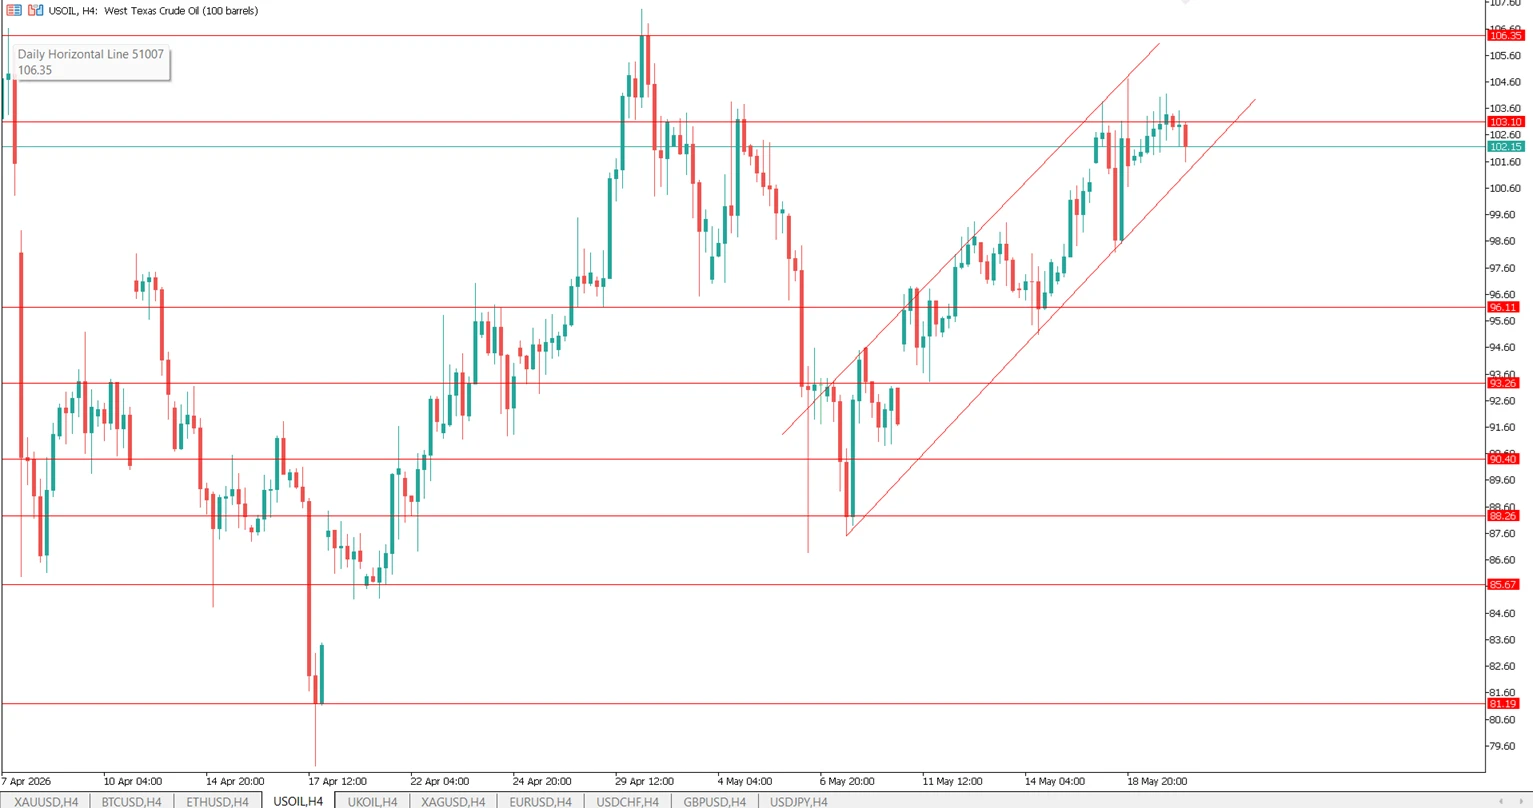
- Uptrend: Price moves higher over time, with higher highs and higher lows.
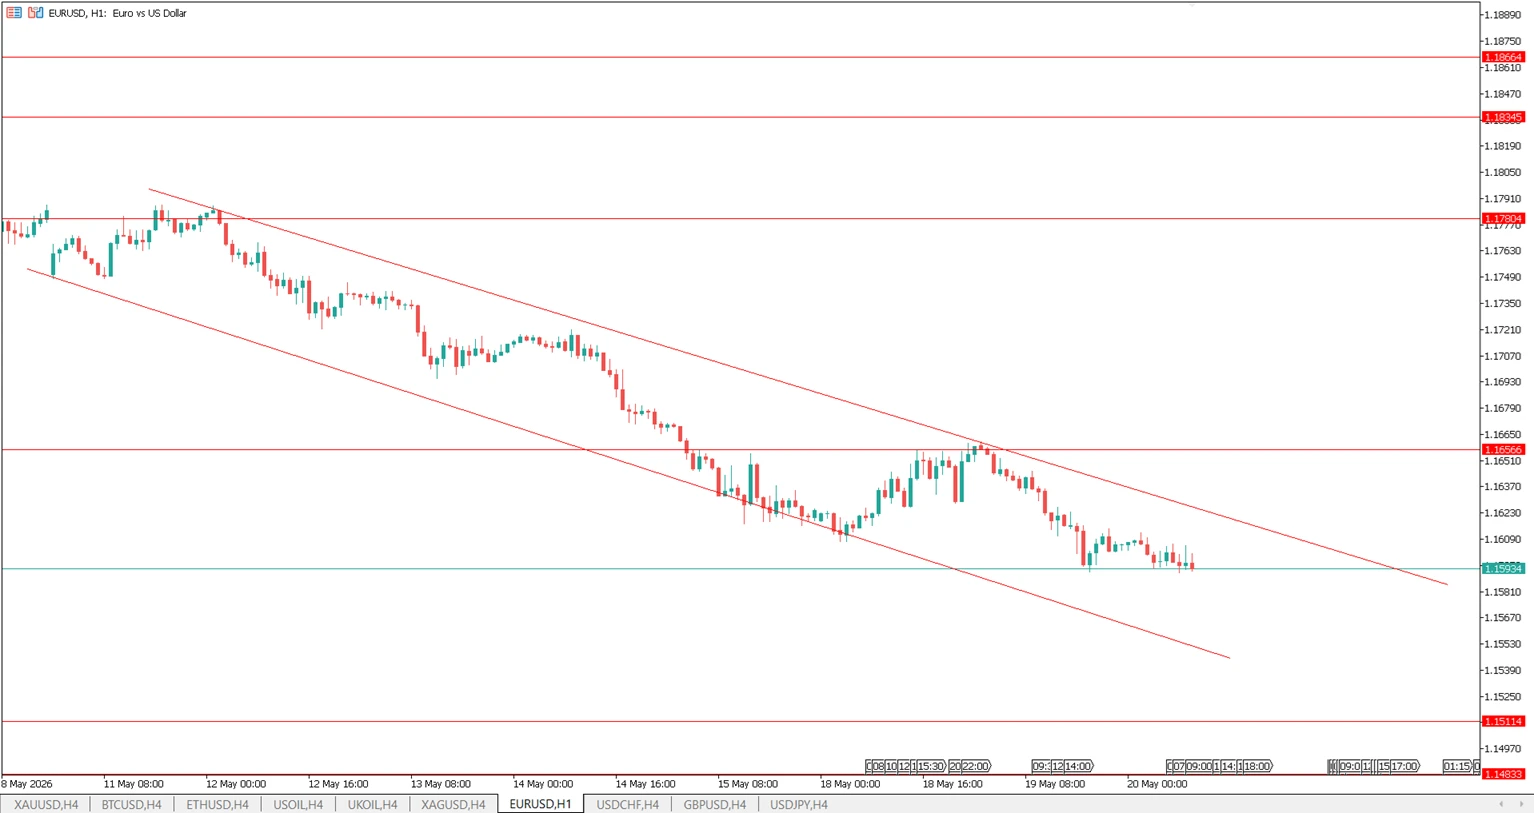
- Downtrend: Price moves lower over time, with lower highs and lower lows.
- Sideways trend: Price trades between support and resistance, with no clear directional bias.
Some traders also describe trends by time frame, such as minor, intermediate, and major trends. This matters because a stock or currency pair can look bullish on one chart and bearish on another.
How Do Traders Identify a Trend?
Traders identify trends by studying price action and chart structure. The simplest method is to look at the pattern of highs and lows. If each new swing high and swing low is higher than the previous one, the market is likely in an uptrend. If each new swing high and swing low is lower, the market is likely in a downtrend. A trendline or moving average can help confirm what price structure is already showing.
What Is Market Structure?
Market structure is the pattern of highs and lows that shows how price behaves. In a bullish structure, price creates higher highs and higher lows. In a bearish structure, price creates lower highs and lower lows. In a neutral structure, price lacks clear progression and often stays range-bound. Market structure is important because it gives traders a clean way to judge whether a trend is still intact or starting to weaken.
Which Indicators Help Confirm Trends?
Several indicators can help confirm a trend, but none should be used alone.
- Moving averages smooth price data and show the general direction of the market.
- MACD helps identify momentum and possible trend shifts.
- ADX measures trend strength rather than direction.
- RSI can show whether price is stretched too far within a trend.
- Volume can support trend confirmation when movement is backed by participation.
Beginners usually get better results by combining price structure with one or two indicators rather than depending on a single signal.
Trend vs Range Market
A trending market moves in one direction with visible momentum. A range market moves sideways between support and resistance. This difference matters because trend-following strategies work better in trending conditions, while reversal or breakout tactics often fit range markets more effectively. One common beginner mistake is assuming every market is trending when many charts are simply consolidating.
Feature | Trending Market | Range Market |
Direction | Clear upward or downward movement | No clear direction |
Price behavior | Higher highs/lows or lower highs/lows | Moves between support and resistance |
Best approach | Follow momentum | Trade the range or wait for breakout |
Risk for beginners | Chasing late entries | Mistaking noise for trend |
How to Trade with the Trend
Trading with the trend means entering in the same direction as the market’s main move. In an uptrend, traders often look for pullbacks to support or a moving average. In a downtrend, they often look for rallies that fail near resistance. The goal is not to buy at the exact bottom or sell at the exact top, but to enter when the trend still has room to continue. This approach is often easier for beginners than trying to predict reversals.
Common Beginner Mistakes
Beginner traders often make the same errors when working with trends:
- Trading against a strong trend too early.
- Entering after the move is already overextended.
- Using too many indicators at once.
- Ignoring higher time frames.
- Confusing a temporary pullback with a trend reversal.
A simple rule is to first identify the trend on a higher time frame, then look for entries on a lower time frame.
Simple Trend Checklist
Use this checklist before placing a trade:
- Is the market making higher highs and higher lows, or lower highs and lower lows?
- Is price above or below a key moving average?
- Is the move supported by momentum or volume?
- Is the market trending or moving sideways?
- Is there a clear support or resistance level nearby?
If most of the answers point in the same direction, the trend is likely easier to trade.
FAQ
What is the easiest way to spot a trend?
The easiest way is to look at the sequence of highs and lows on a chart. Higher highs and higher lows usually mean an uptrend, while lower highs and lower lows usually mean a downtrend.
What is the best indicator for trends?
Moving averages are one of the simplest tools for identifying trends. Many traders also use MACD or ADX to confirm direction and strength.
Can a trend change quickly?
Yes. Trends can shift after major news, strong reversals, or a break in market structure. That is why traders watch both price action and confirmation signals.
Is trend trading good for beginners?
Yes. Trend trading is often easier for beginners because it follows the market’s existing direction instead of trying to predict turning points.
How long can a trend last?
A trend can last for minutes, days, or months depending on the time frame. Longer trends on higher time frames are usually more reliable than short ones.
Conclusion
Technical analysis trends help beginners understand market direction, spot trading opportunities, and avoid random decision-making. The most important skill is learning to identify whether price is trending up, trending down, or moving sideways. Once that is clear, trendlines, moving averages, and market structure can help confirm the setup. For most beginners, the best approach is simple: identify the trend, wait for a pullback, and trade in the direction of momentum.
Geri dön Geri dön
