Understanding market direction is one of the cornerstones of successful trading. Whether you're buying or selling, entering or exiting, knowing the trend gives you a significant edge. One of the simplest yet most effective tools for identifying trends is the trendline. In this article, we’ll take a deep dive into trendlines—what they are, how to draw them correctly, and how to use them in real trading scenarios across Forex, crypto, commodities, and indices.
What Are Trendlines?
A trendline is a straight line that connects two or more price points and extends into the future to act as a line of support or resistance. Trendlines are visual tools that help traders quickly identify the prevailing market direction:
- Uptrend line connects higher lows
- Downtrend line connects lower highs
- Sideways (range-bound) lines connect horizontal highs and lows
They are foundational to technical analysis and form the basis for more advanced strategies. When drawn correctly, trendlines can help traders anticipate where price may bounce or break, providing entry and exit signals in a clear and logical way.
Types of Trendlines and How to Draw Them
1. Uptrend Line
An uptrend is formed when price creates a series of higher lows. To draw an uptrend line:
- Identify at least two major swing lows.
- Draw a line connecting them.
- Extend the line into the future.
This line acts as dynamic support, and traders often look for long entries when price pulls back to the trendline.
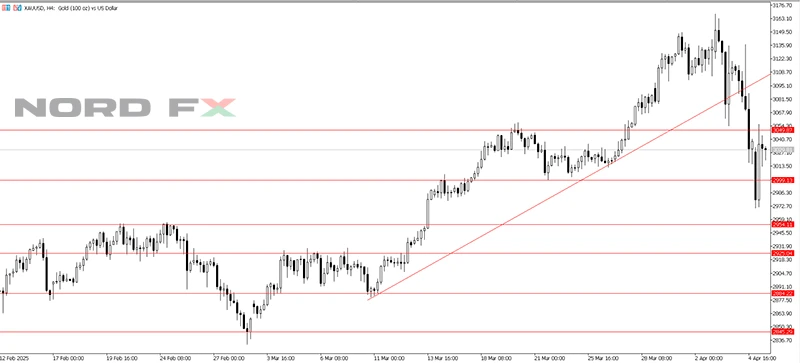
Example:
On an H4 chart of XAUUSD (Gold), an uptrend was clearly defined before the price fell. Price repeatedly pulled back to the ascending line. Each bounce offered a potential trade entry with limited downside risk. After the trendline was broker, bear sentiment overtook the gold market.
2. Downtrend Line
A downtrend forms when the market is making lower highs. To draw a downtrend line:
- Connect at least two swing highs.
- Extend the line forward.
This acts as dynamic resistance, and traders look for short entries when price tests the line from below.
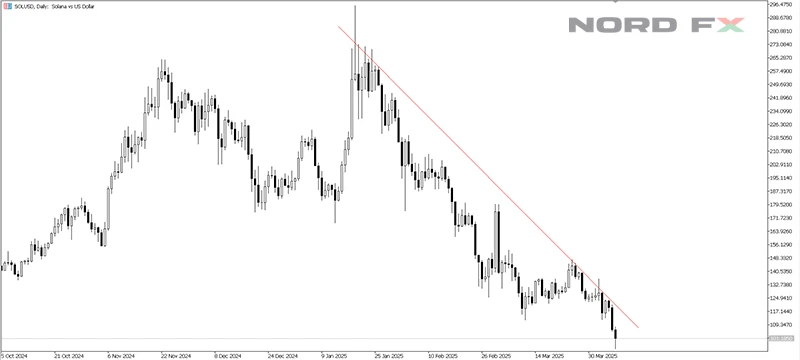
Example:
On the Daily chart of SOLUSD (Solana), a strong downtrend is visible, with price falls so steep that it doesn’t even reacting a downward-sloping trendline in some cases.
3. Sideways Trend / Consolidation
Markets don’t always trend. When price is ranging:
- Draw a horizontal upper line across swing highs (resistance)
- Draw a horizontal lower line across swing lows (support)
Price tends to move back and forth between these levels until a breakout occurs.
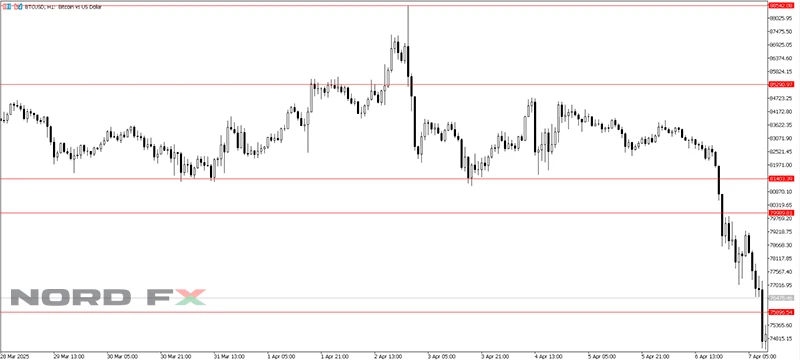
Example:
In March and beginning of April BTCUSD on the H1 timeframe entered a sideways consolidation phase, respecting both horizontal support and resistance before falling down.
Timeframes: Why They Matter
Trendlines work across all timeframes, but how you apply them depends on your trading style.
- H1 / H4: Useful for intraday traders seeking shorter, more frequent setups.
- Daily / Weekly: Ideal for swing or long-term traders looking to stay in trades longer and capture major moves.
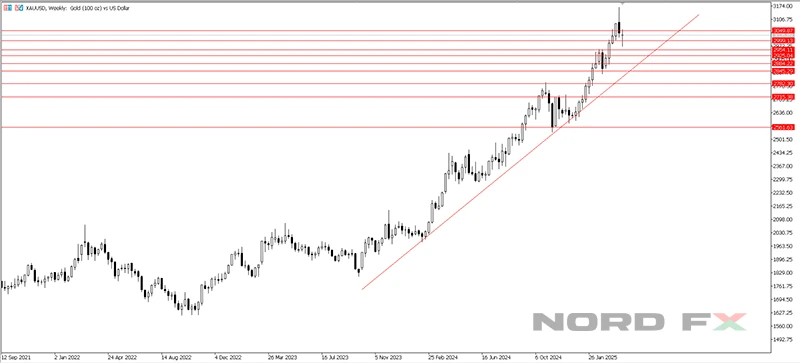
Example:
On a Weekly chart of Gold (XAUUSD), a long-term uptrend has held for months. These trendlines help identify the broader trend and are critical for longer-term positioning.
Trading with Trendlines: Techniques and Tips
1. Trendline Bounce (Trend Continuation)
When price pulls back to a trendline and bounces, it often signals a continuation of the existing trend. Traders may:
- Enter on confirmation (e.g., bullish candle near the uptrend line)
- Place a stop-loss just below the trendline
- Target prior swing highs/lows for profit-taking
This method works especially well when the trendline has been respected multiple times.
2. Trendline Break (Reversal or Correction)
A break of a well-respected trendline can indicate a trend reversal or a deeper correction. Traders may:
- Wait for a clear break with strong momentum
- Look for a retest of the broken line
- Enter in the direction of the new move, once confirmed
This is often the first sign that the trend is weakening or ending.
3. Avoiding Fakeouts
Not every break is meaningful. To reduce false signals:
- Make sure the trendline has at least three touches
- Wait for a candle to close clearly beyond the line
- Look for other confirming factors (e.g., chart patterns or volume)
Trendlines are best used in conjunction with overall price structure and not in isolation.
Trendline Angle and Strength
The angle of a trendline can also reveal a lot about the market’s strength. A steep trendline often suggests aggressive momentum, but these trends may not last. Once broken, price can fall quickly. A gently sloped trendline indicates a healthier, more sustainable trend. These often last longer and provide more reliable trading opportunities.
If you find yourself constantly redrawing a trendline because price keeps breaking it, it could be a sign that the trend is too volatile, or you’re drawing it too steeply. Always give the market enough room to “breathe.”
Adjusting Trendlines with Market Conditions
Markets evolve. What was a valid trendline yesterday may become obsolete today. It’s important to remain flexible. If price fails to respect a trendline or breaks it convincingly, don’t try to force the structure. Reassess, redraw, and adapt. Good trendlines should reflect what the market is doing now, not what it did a week ago.
Some traders also draw internal trendlines — secondary lines that capture smaller movements within a larger trend. This can help identify shorter-term opportunities without losing sight of the big picture.
Common Mistakes to Avoid
- Forcing a trendline where one doesn’t exist
- Connecting only two points and assuming it's valid
- Ignoring the number of touches — three or more gives the line strength
- Using trendlines alone without reading overall price context
- Failing to adjust lines as new price data becomes available
Trendlines should serve your analysis, not dictate it. Use them with purpose, use them with other technical indicators, not just as decoration.
Final Thoughts
Trendlines are one of the simplest tools in technical analysis, yet they can be incredibly effective when used correctly. They help identify the market direction, spot entry points, manage risk, and filter out noise. With time and practice, you’ll learn to draw them accurately and read price action with greater clarity.
They are especially useful in fast-moving markets like crypto and gold, where momentum can shift quickly. Drawing trendlines across multiple timeframes also gives you a layered view of market behavior, from micro swings to macro trends.
Ready to Practice?
You can download and install the MetaTrader 5 (MT5) trading terminal and start practicing trendline analysis today. Draw trendlines across different assets and timeframes, watch how price interacts with them, and learn from real chart behavior. Over time, trendlines will become a natural extension of your trading process.
Disclaimer: These materials are not an investment recommendation or a guide for working on financial markets and are for informational purposes only. Trading on financial markets is risky and can lead to a complete loss of deposited funds.
Go Back Go Back
