What is a shooting star candlestick pattern?
Answer: A shooting star is a bearish reversal candlestick that forms after an uptrend. It has a small body near the session's low and a long upper wick — at least twice the body length — with little or no lower shadow. It signals that buyers failed to hold higher prices and sellers took control before the close.
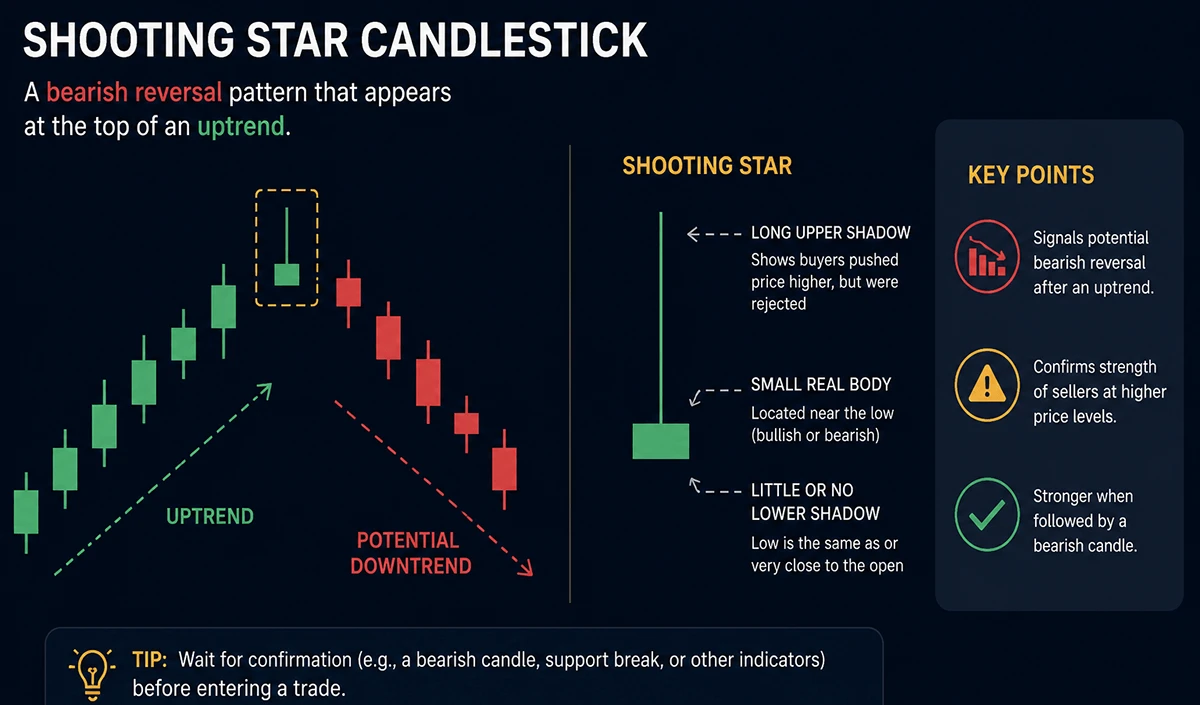
A shooting star is a single bearish reversal candlestick that appears after an uptrend. It has a small body near the session's low and a long upper wick — at least twice the body length — with little or no lower shadow. It signals that buyers pushed prices higher during the session, but sellers stepped in before the close, forcing prices back down.
Traders use shooting stars to time potential trend reversals and identify short entry opportunities, exit signals for existing long positions, or areas to watch for a larger price correction.
This guide covers how to identify the pattern, confirm it, trade it across gold, oil, crypto, and currency pairs, and use it in MT4 and MT5.
What Is a Shooting Star Candlestick?
The shooting star is a Japanese candlestick pattern rooted in price action analysis developed in 17th-century Japan. Despite the name, it has nothing to do with market luck — it is a structured signal of selling pressure at elevated prices.
The pattern belongs to the same family of bearish reversal signals as the evening star and the hanging man. Its defining feature is the long upper wick, which represents a failed attempt by buyers to sustain higher prices within a single session.
Shooting Star Anatomy
A valid shooting star must meet these criteria:
- Small real body positioned near the bottom of the candle's range
- Upper wick at least 2× the body length — the longer the wick, the stronger the rejection signal
- Little or no lower shadow (lower wick should be less than 20% of the total candle range)
- Formed after a clear uptrend or price advance
The candle body can be red (bearish close) or green (bullish close). A red body is considered a stronger signal because the price closed below the open, confirming sellers dominated by the session's end.
Red vs Green Shooting Star
Red Shooting Star | Green Shooting Star | |
Close vs Open | Close below open | Close above open |
Signal strength | Stronger bearish | Moderate bearish |
What it shows | Sellers fully dominated | Buyers held on slightly but failed to sustain highs |
Both are valid signals. Red shooting stars carry more weight, especially at major resistance levels.
How to Identify a Shooting Star Candlestick — Step by Step
Step 1: Confirm a prior uptrend exists. The shooting star is only meaningful after price has been rising. Without a prior advance, the pattern carries no reversal implication.
Step 2: Locate a candle with a long upper wick. Look for a candle where the distance from the body to the wick high is at least twice the size of the body itself.
Step 3: Check the lower shadow. The lower wick should be very small — ideally absent. A long lower shadow weakens the pattern.
Step 4: Verify context — resistance or overhead supply. A shooting star formed at a known resistance level, previous swing high, Fibonacci zone, or moving average adds significant weight to the signal.
Step 5: Wait for confirmation. The next candle should close below the shooting star's body. This confirms sellers are following through rather than simply pausing.
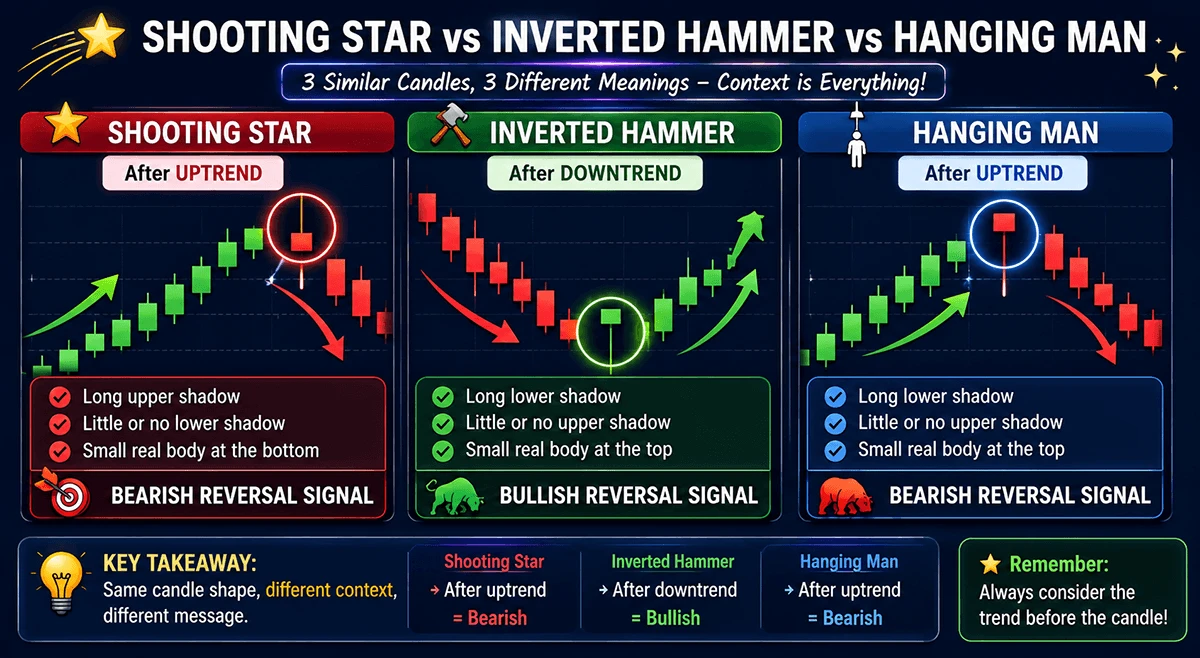
Shooting Star vs Similar Patterns
The shooting star is often confused with three other patterns that share a similar visual structure. Context — specifically whether price was rising or falling before the candle formed — is the key differentiator.
Pattern | Direction before candle | Signal type | Lower shadow |
Shooting star | After uptrend | Bearish reversal | None/very small |
Inverted hammer | After downtrend | Bullish reversal | None/very small |
Hanging man | After uptrend | Bearish reversal | Long lower wick |
Evening star | After uptrend | Bearish reversal (3-candle pattern) | N/A |
The inverted hammer looks identical to a shooting star but signals the opposite. If you see this candle after a sustained price drop, it indicates potential bullish reversal, not continuation of selling. Trend context is everything.
What the Shooting Star Tells You About the Market
Understanding the psychology behind the pattern improves how you apply it.
Buying Exhaustion
When a shooting star forms, buyers were initially in control — the long upper wick proves they pushed price meaningfully higher. But they could not hold those gains. By the close, sellers overwhelmed them, pulling the price back near the open.
This is not random volatility. It reflects a specific battle where buyers ran out of momentum at higher prices. It often appears when a bullish move is overextended, or when the price reaches a level where institutional participants start distributing (selling into strength).
Seller Commitment at a Specific Level
The upper wick marks the exact price level where sellers stepped in aggressively. On subsequent sessions, that level often acts as resistance. If price retests the wick high and fails again, the level gains more significance.
It Is a Warning, Not a Guarantee
A shooting star is a single-session event. Many form without triggering a reversal — especially in strong trending markets. The pattern's value is in directing your attention to a potential inflection point, not in predicting the future with certainty.
Use it as a trigger to look for confirmation, not as an automatic sell signal.
How to Trade the Shooting Star Candlestick Pattern
Entry: Wait for the Confirmation Candle
The safest approach is to wait for the candle following the shooting star to close below the shooting star's body. This confirmation candle validates that sellers are continuing to drive price lower.
Aggressive entry: Short at the close of the shooting star candle itself. Offers better risk/reward but higher false signal rate.
Conservative entry: Short at the close of the confirmation candle (the bearish candle that follows). Lower risk/reward ratio but higher trade accuracy.
Stop Loss Placement
Place your stop loss above the high of the shooting star's upper wick, plus a small buffer to avoid being stopped out by minor fluctuations. How much buffer depends on the volatility of the asset — on gold and crypto, a wider buffer is needed than on lower-volatility currency pairs.
Rule of thumb: Stop loss = wick high + (Average True Range × 0.25)
Take Profit Targets
The shooting star has no automatic measured-move target. Use these approaches instead:
- Next major support level — the most logical target. Look for previous pivot lows, round numbers, or demand zones.
- Risk:reward ratio — minimum 1:1.5. If your stop is 20 pips from entry, target at least 30 pips.
- Breakout pattern targets — if the shooting star forms at the top of a rising channel or near the completion of a double top, the pattern's measured move becomes your target.
Risk Management Considerations
When trading shooting stars via CFDs with leverage, position sizing is critical. Even a high-accuracy signal can result in significant losses if you risk too much per trade.
- Keep risk per trade at 1–2% of your account equity
- Do not add to a losing position hoping for a reversal
- High-leverage environments amplify both profits and losses — the wick that forms the shooting star can spike further before reversing
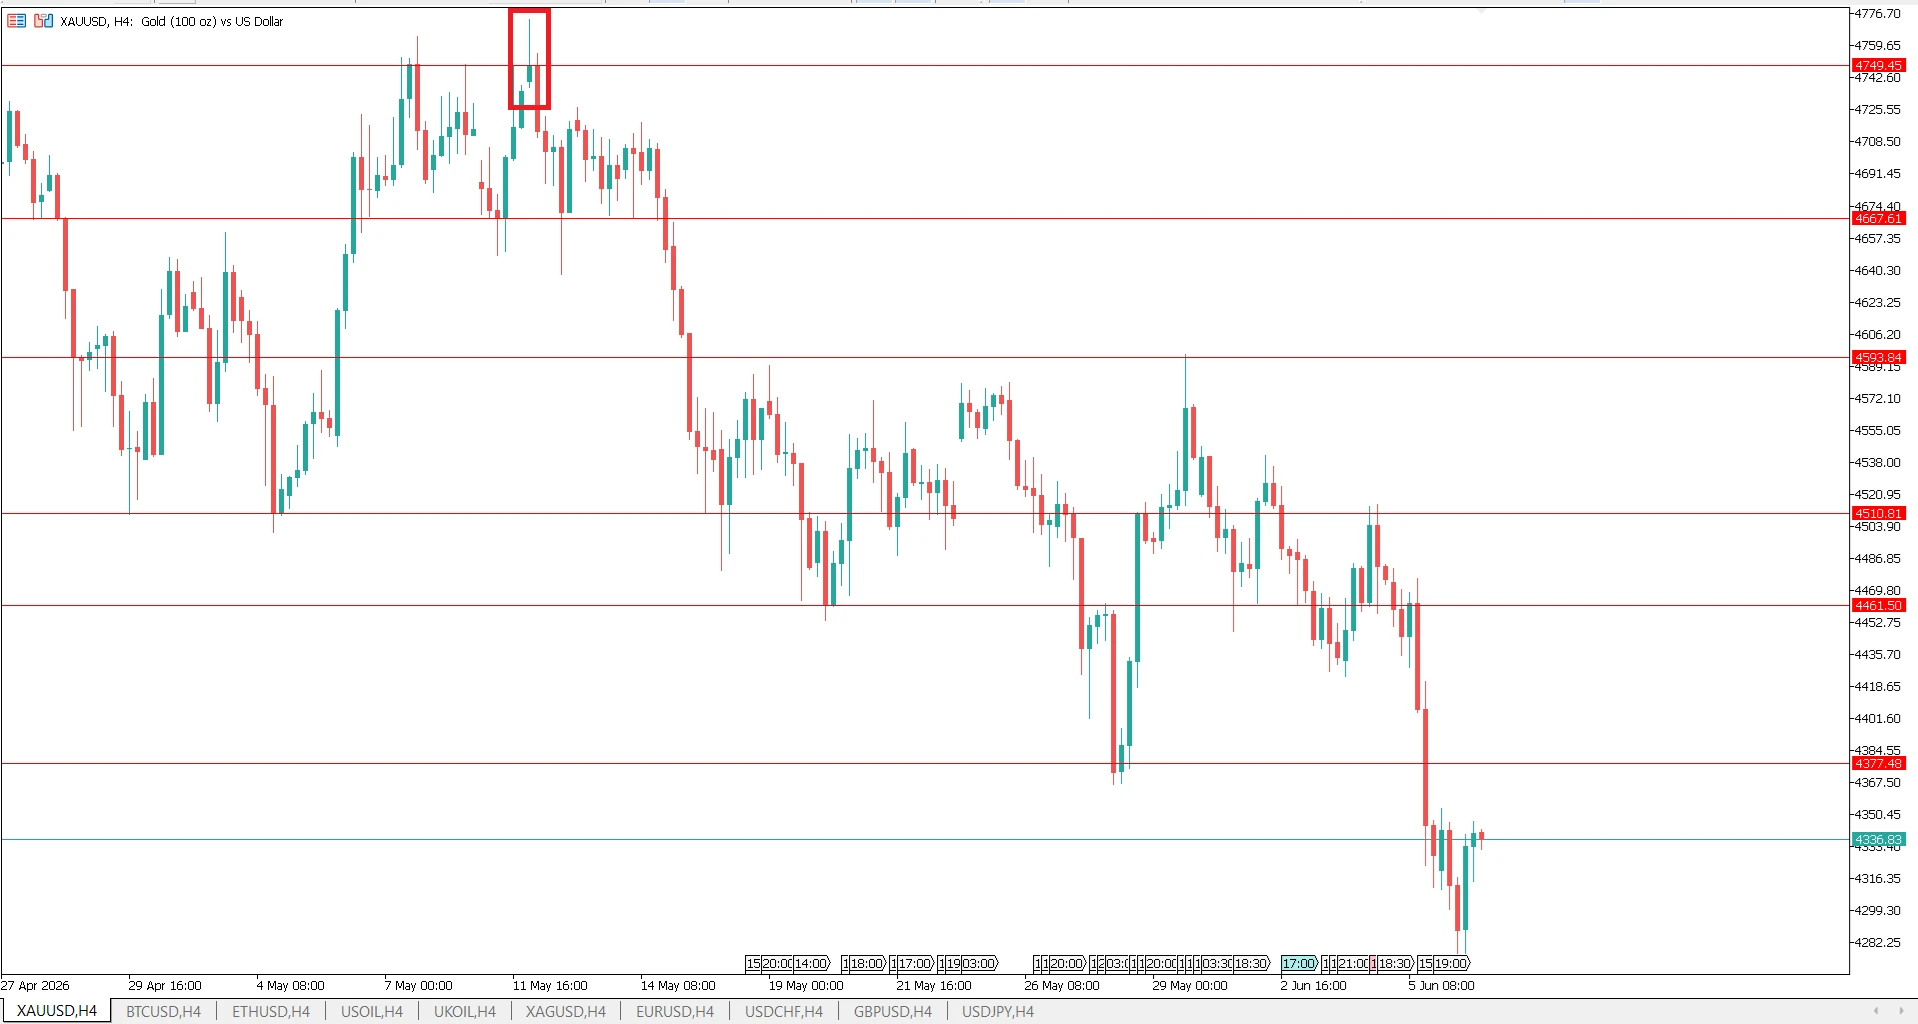
Real example: XAUUSD H4, May 2026
Around May 11, 2026, a shooting star formed on the XAUUSD H4 chart at the $4,749 resistance level — a key zone that had capped price on previous rallies. The candle had a long upper wick reaching into $4,749.45 with the body closing near the lower end of the range. A textbook setup: prior uptrend, known resistance, clear wick rejection.
The confirmation candle on the following session closed below the shooting star body. Price then declined over the next three weeks from the $4,749 area down through support levels at $4,593, $4,510, and $4,461, eventually reaching approximately $4,282 — a drop of around 450 points from the pattern high.
A trader entering short on the confirmation candle close near $4,700, with a stop above the wick at $4,760 and a first target at the $4,461 support, would have seen a risk-to-reward ratio of approximately 1:4. This is a strong real-world example of the pattern working as intended — rejection at resistance, confirmation, and sustained follow-through. Not every shooting star produces a move of this size, which is exactly why position sizing and stop discipline matter regardless of how clean the setup looks.
Shooting Star Trading Strategies
Strategy 1: Sell the Rally in a Downtrend
This is the most reliable context for trading shooting stars. If price is already in a downtrend — forming lower highs and lower lows — look for shooting stars on the rebound.
Setup:
- Price is in a confirmed downtrend
- Price rallies to a previous resistance level or Fibonacci retracement (38.2%, 50%, 61.8%)
- A shooting star forms at or near that level
- Confirmation candle closes below the shooting star body
- Enter short, stop above the wick, target the previous swing low
This strategy works because the shooting star aligns with the existing trend, increasing the probability that sellers will resume control.
Strategy 2: Shooting Star at Resistance
A shooting star formed at a well-defined resistance level is significantly more reliable than one formed in open space.
Resistance types to watch:
- Previous swing highs (price has rejected this level before)
- Round numbers (1.1000 on EUR/USD, $4000 on gold, $65000 on BTC)
- Fibonacci retracement levels applied to a recent swing
- 50-period or 200-period moving average (acting as dynamic resistance)
- Supply zones identified from higher timeframes
The more confluence you can stack at one level, the stronger the signal. A shooting star at a previous swing high that also coincides with the 61.8% Fibonacci retracement and a descending 50-period moving average is a higher-probability setup than one formed in isolation.
Strategy 3: Multi-Timeframe Confirmation
A shooting star on the daily chart carries more weight than one on a 15-minute chart. But the best setups combine both.
How to apply it:
- Identify a shooting star on the daily or weekly chart — this establishes the macro signal
- Drop to a 4-hour or 1-hour chart to time your entry more precisely
- Look for follow-through bearish price action on the lower timeframe — a break of a minor support level, a second shooting star, or a bearish engulfing pattern
- Enter on the lower timeframe with the daily-level stop
This approach captures the directional bias from a larger timeframe while giving you a tighter stop loss for better risk/reward.
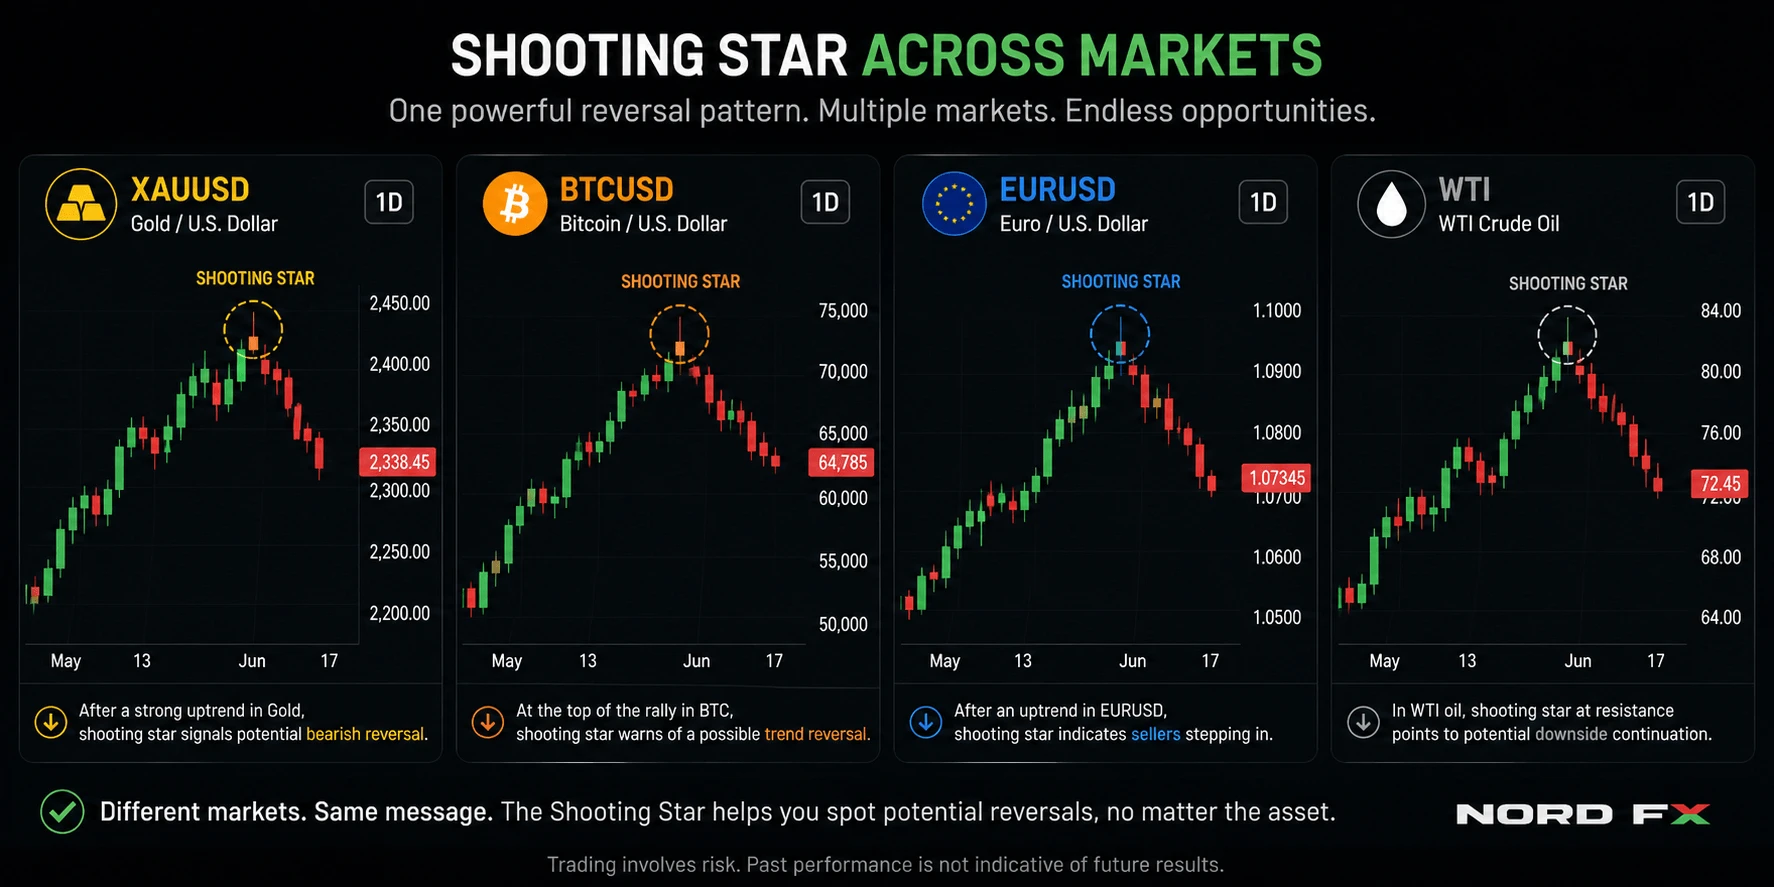
Trading the Shooting Star Across Different Markets
The shooting star appears across all liquid markets. How you apply it depends on the asset's characteristics.
Gold (XAUUSD)
Gold is one of the best markets for shooting star setups. It trends strongly, makes sharp reversals at psychological levels ($3,500, $4,000, $4,500, etc.), and frequently forms high-wick rejection candles after news-driven spikes.
What to watch on gold:
- Shooting stars at all-time highs or major resistance round numbers
- After sharp intraday spikes driven by US CPI or Fed decisions
- On the daily chart, where gold's trend structure is most reliable
Gold's volatility means stop losses should be placed generously above the wick — tight stops on gold get stopped out frequently.
Oil (WTI, Brent)
Oil is sensitive to supply-side news and OPEC decisions. Shooting stars on oil often form after inventory report spikes or geopolitical premium events where price overshoots and then reverses.
Look for shooting stars at previous supply zone highs or after overnight gap-up opens that fail to hold.
Cryptocurrency (BTC, ETH)
Crypto markets produce many shooting stars due to their volatility, but the false signal rate is higher than in more mature markets. Two filters that help:
- Require a strong upper wick — at least 3× the body size, not just 2×. Crypto regularly produces long-wick candles that don't reverse.
- Use daily or 4-hour timeframes only — crypto on lower timeframes generates significant noise. Hourly and 15-minute shooting stars on BTC are unreliable.
- Check Bitcoin dominance context — if the broader crypto market is in a risk-off phase, shooting stars on individual altcoins gain more weight.
Currency Pairs
On major currency pairs (EUR/USD, GBP/USD, USD/JPY), shooting stars tend to be more precise because liquidity is higher, wick manipulation is less common, and price action respects technical levels more consistently.
Currency pair shooting stars work especially well:
- At psychological price levels (1.1000, 1.3000, 150.00)
- Before major macro events (NFP, central bank meetings) when price extends and reverses
- On the weekly chart after multi-month rallies
Common Mistakes When Trading Shooting Stars
Selling immediately on appearance, without confirmation. The most common error. Many shooting stars do not lead to reversals. Always wait for a confirmation close below the body.
Ignoring the trend. A shooting star in a strong uptrend is far less likely to trigger a reversal than one at the end of an extended move or in a downtrend. Trend context is not optional.
Using tight stops below a volatile asset's wick. Getting stopped out on the wick, then watching the trade reverse in your direction, is one of the most frustrating trading experiences. Give the stop room.
Treating every long-wick candle as a shooting star. The wick must be at least 2× the body, there must be a prior uptrend, and the body must be near the bottom of the range. A candle with a long upper wick that also has a long lower wick is a doji or spinning top — a different signal.
Not adjusting position size for leverage. CFD trading with leverage means the same pattern can produce dramatically different outcomes depending on lot size. Keep position sizing consistent regardless of how confident you feel about a setup.
How to Find Shooting Stars on MT4 and MT5
Neither MT4 nor MT5 has a built-in shooting star scanner by default, but there are practical approaches to spotting them efficiently.
Visual Scanning
On MT4 or MT5, open your chart on the daily timeframe and scan for candles with visually long upper wicks. Most experienced traders can spot these at a glance. Focus on candles where the upper wick is noticeably longer than anything nearby on the chart.
Custom Indicators
Several free shooting star indicators are available via the MT4/MT5 MQL marketplace. These tools automatically mark valid shooting stars on the chart with an arrow or label. Look for indicators that let you configure the wick:body ratio threshold.
Manual Checklist Before Any Trade
Before entering a shooting star trade in MT4/MT5:
- Is the upper wick at least 2× the body? ✓
- Was there a clear uptrend before this candle? ✓
- Is the lower wick small (less than 20% of candle range)? ✓
- Is this near a known resistance level or zone? ✓
- Has the confirmation candle closed below the body? ✓
- Is my stop above the wick high with a buffer? ✓
- Is my position size within my 1–2% risk rule? ✓
Running through this checklist before entering prevents impulsive trades on incomplete setups.
FAQ
What is a shooting star candlestick?
A shooting star is a single bearish reversal candlestick that forms after a price advance. It has a small body near the session's low and a long upper wick (at least twice the body), with little or no lower shadow. It signals that buyers were rejected at higher prices and sellers regained control by the close.
Is a shooting star always a sell signal?
No. A shooting star is a warning of potential reversal, not a guaranteed sell signal. It requires confirmation from the following candle and is more reliable when it forms near a recognized resistance level, in a downtrend, or after an extended price advance.
What is the difference between a shooting star and an inverted hammer?
They have identical shapes — small body, long upper wick, small lower shadow — but opposite meanings. A shooting star forms after a price advance (bearish signal). An inverted hammer forms after a price decline (bullish signal). Context determines the interpretation.
How do you confirm a shooting star?
Confirmation comes from the next candle closing below the shooting star's real body. This shows that selling pressure is continuing rather than stalling. A gap down on the next candle open is an additional confirmation signal.
Does the shooting star work on cryptocurrency?
Yes, but with lower reliability than on gold or currency pairs due to crypto's higher base volatility. On crypto, increase your wick:body ratio threshold to 3× and use daily or 4-hour timeframes to reduce noise.
Where should I place my stop loss for a shooting star trade?
Above the high of the upper wick, plus a volatility-adjusted buffer. On gold or crypto, this buffer should be wider (roughly 0.25× the Average True Range). Stops placed too close to the wick high get triggered frequently before the actual reversal develops.
What is the best timeframe for shooting star patterns?
Daily and 4-hour timeframes produce the most reliable shooting star signals. Weekly shooting stars mark significant macro reversal zones. Lower timeframes (15-minute, 1-hour) produce more signals but also more false positives.
Conclusion
The shooting star candlestick pattern is one of the most recognized bearish reversal signals in technical analysis. When it appears at the right location — after an uptrend, at a known resistance zone, with confirmation from the next candle — it provides a clear, actionable trade setup with defined entry, stop, and target levels.
Its strength lies not in the pattern itself, but in how you contextualize it: trend direction, resistance level confluence, timeframe, and the behavior of the assets you trade. A shooting star on gold at a $4,500 resistance zone after a two-week rally is a materially different signal than the same candle shape appearing mid-trend on a 15-minute crypto chart.
Apply the identification rules, stack your confluences, use confirmation, and size your position properly. The pattern gives you the signal — risk management determines the outcome.
Open a trading account with NordFX
Meet the Author
Vanessa Polson is a marketing manager at NordFX with over twelve years of experience in online marketing within the financial services industry. She has developed and executed data-driven campaigns across search, social, and display channels in in-house environments. Her work focuses on translating complex financial products and trading tools into clear, practical educational content, giving her a broad and well-rounded view of the global trading landscape.
Connect with Vanessa on LinkedIn.
ফিরে যান ফিরে যান
