In the world of technical analysis, candlestick patterns play a vital role in helping traders make informed decisions—and one of the most powerful among them is the hammer candlestick. Recognized for its distinct shape and strong reversal signals, the hammer appears at the bottom of a downtrend and suggests that buying pressure may be stepping in. Whether you're a beginner learning the basics or an experienced trader looking to refine your entry points, understanding how the hammer candlestick works can give you a valuable edge in the market. This guide explores the structure, types, trading strategies, and practical applications of the hammer candlestick pattern in detail.
Table of Contents
Why are hammer candlesticks important?
Structure of a Hammer Candlestick Pattern
Occurrence of the Hammer Candlestick Pattern
Frequency of the Hammer Candlestick Pattern
Types of Hammer Candlestick Patterns
Trading the Hammer Candlestick Pattern in Forex
Tips for Trading with the Hammer Candlestick
Example of a Hammer Candlestick Pattern
How do you identify the Hammer Candlestick Pattern in technical analysis?
How accurate is the Hammer Candlestick Pattern in Technical Analysis?
What are the advantages of a Hammer Candlestick?
What are the disadvantages of a Hammer Candlestick?
Is Hammer Candlestick Pattern profitable?
Is a Hammer Candlestick Pattern Bullish or Bearish?
What are other Types of Candlestick besides Hammer?
Limitations of a Hammer Candlestick
Key Takeaways
- The Hammer candlestick is a single-bar pattern that often indicates a potential bullish reversal after a downtrend.
- It features a small real body at the top of the candle with a long lower shadow.
- There are two variations: Bullish Hammer and Bearish Hammer (also known as Hanging Man).
- Trading strategies involve identifying the pattern, confirming the reversal, entering a trade, managing it, and analyzing the outcome.
- The pattern serves as a visual cue for traders to anticipate potential market reversals.
🔗 what
What is a Hammer Candlestick?
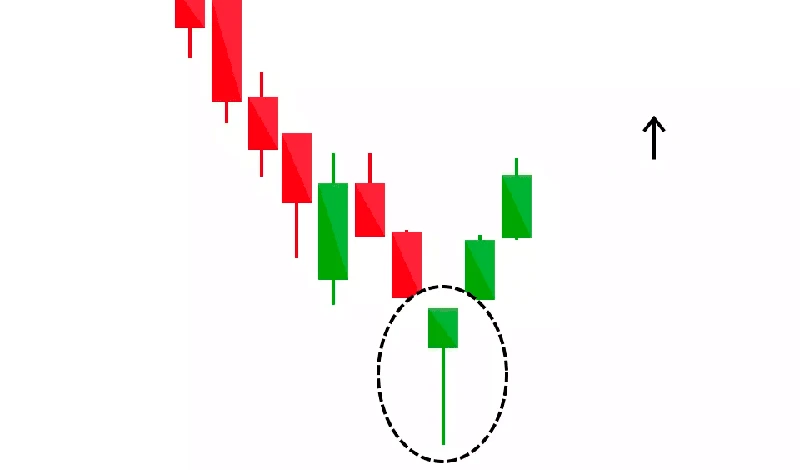
A hammer candlestick is a single-candle formation that typically appears at the bottom of a downward price movement. It forms when the price of an asset drops significantly during a trading session but then recovers, closing near or slightly above its opening level. This sharp recovery from the session’s low creates a candle with a small real body at the top and a long lower shadow, giving it the appearance of a hammer. The shape of the candle suggests that, although sellers initially dominated the session, buyers stepped in with enough strength to reverse much of the decline. The hammer’s formation often reflects a shift in market sentiment, as buyers begin to overpower sellers. It is considered an early sign that a downtrend may be losing momentum, making it especially useful for traders who are looking for signs of a potential bullish reversal.
🔗 important
Why are Hammer Candlesticks Important?
Hammer candlesticks hold significance in technical analysis because they offer insight into market psychology at critical turning points. When this pattern appears after a sustained decline, it suggests that selling pressure may be exhausted and that buyers are starting to regain control. This can lead to a shift in trend direction or at least a temporary bounce in price. For traders and investors, spotting a hammer candlestick can serve as an alert to monitor the market closely for a possible change in momentum. It provides an opportunity to enter long positions at favorable prices or to tighten stop-loss levels on short positions. The hammer is also important because it offers a visual, easy-to-understand representation of intraday market dynamics, making it accessible even to traders with limited experience in chart reading. When used in conjunction with other technical tools, such as support zones or volume analysis, the hammer pattern becomes a practical and powerful signal within a broader trading strategy.
🔗 Structure
Structure of a Hammer Candlestick Pattern
The hammer candlestick is known for its unique and easily recognizable shape, which reflects the psychological battle between buyers and sellers within a single trading period. Its most notable feature is the real body, which is small in size and positioned near the upper part of the total price range. This small body shows that the opening and closing prices were relatively close to each other, with the closing price ideally above or very near the opening level.
Beneath the real body is a long lower shadow, which should be at least twice the length of the body itself. This lower shadow represents the significant downward price movement that occurred during the session as selling pressure temporarily pushed the price lower. However, the key detail is that buyers eventually stepped in with enough force to absorb the selling and lift the price back toward the opening level by the close. This recovery is what creates the long wick below the body, signaling strong buying interest at lower prices.
The upper shadow of the candle is typically very short or completely absent, indicating that there was little upward price movement beyond the opening and closing levels. This lack of upper shadow helps reinforce the visual of a hammer shape and also reflects the idea that once buyers took control, the price stabilized rather than fluctuating significantly.
Altogether, the shape of the hammer candlestick provides valuable information. It tells the story of a market session that began with bearish sentiment, but turned bullish by the end, suggesting that selling pressure is weakening and that a potential shift in trend may be on the horizon. The longer the lower shadow, the more significant the rejection of lower prices appears to be, giving traders a reason to pay close attention to the candle's implications.
🔗 Occurrence
Occurrence of the Hammer Candlestick Pattern
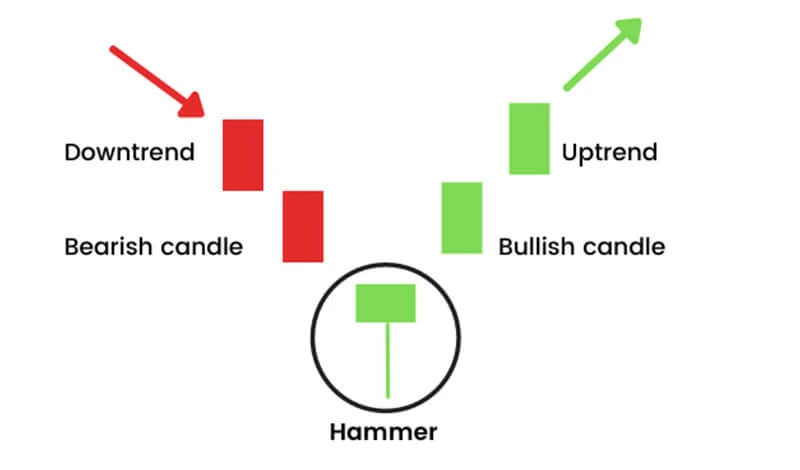
The hammer candlestick pattern usually appears after a period of declining prices, when market sentiment has been largely negative and selling activity has been dominant. This downward trend may have lasted for several sessions or even weeks, creating a general expectation that prices will continue to fall. As such, the appearance of a hammer at this stage becomes particularly meaningful because it signals a possible shift in momentum.
During a downtrend, traders often look for signs that selling pressure is beginning to fade and that buyers might be preparing to step back into the market. The hammer pattern fits this scenario well. It represents a trading session where sellers were initially in control, pushing the price to new lows. However, as the session progressed, buying interest emerged and gradually outweighed the downward pressure, causing the price to climb back toward the opening level before the session closed.
This pattern doesn’t guarantee an immediate reversal, but its appearance often marks the start of a stabilization period or a possible recovery. In some cases, the hammer is followed by a small consolidation range or a bullish confirmation candle that strengthens the case for a trend reversal. The context in which the hammer forms is critical. When it appears at a known support level or after an extended downward movement, its implications become stronger and more reliable.
The occurrence of a hammer candlestick can signal that market participants are beginning to reassess the asset’s value and that the selling may have been overdone. This change in sentiment can lead to fresh buying interest, especially from traders who have been waiting for a clear sign of reversal before entering long positions. Therefore, the hammer serves not only as a potential turning point but also as a psychological indicator that confidence may be returning to the market.
🔗 Frequency
Frequency of the Hammer Candlestick Pattern
The hammer candlestick pattern can be observed relatively often in financial markets, especially on charts with shorter timeframes where price fluctuations are more frequent. It is not considered a rare pattern, and traders can expect to encounter it during periods of active market movement. However, the mere appearance of a hammer does not automatically carry strong significance. Its true value depends heavily on the context in which it appears.
The pattern becomes far more important when it forms after a sustained downward movement. A hammer that emerges following a prolonged decline may signal a potential change in momentum, making it a point of interest for those looking to identify possible buying opportunities. In contrast, a hammer that appears during sideways market conditions or in the middle of an uptrend may not have any real implication and can easily be overlooked or misinterpreted.
Since hammers can appear quite frequently, especially on intraday charts, traders are advised not to act on them in isolation. The reliability of the pattern improves significantly when it is supported by other factors. For instance, if the hammer appears near a historical support zone, at a key Fibonacci retracement level, or is accompanied by a noticeable increase in volume, the chances of it marking a true reversal increase. Additionally, waiting for a confirmation candle—typically a bullish candle that closes above the hammer’s high—can further reduce the risk of acting on a false signal.
In essence, the hammer is a common pattern, but its frequency should not be mistaken for consistent reliability. Traders who use this pattern effectively understand that it must be filtered through a broader technical and market-based lens. By combining it with other tools and indicators, they can better gauge whether the pattern is signaling a genuine shift or simply reflecting temporary price action with no lasting impact.
🔗 Types
Types of Hammer Candlestick Patterns
Bullish Hammer
A Bullish Hammer forms after a downtrend and signals a potential reversal to the upside. It indicates that buyers are beginning to gain strength.
Bearish Hammer (Hanging Man)
The Bearish Hammer, or Hanging Man, appears after an uptrend and suggests a potential reversal to the downside. Despite its similar appearance to the Bullish Hammer, its context within the trend differentiates its implication.
🔗 Trading
Trading the Hammer Candlestick Pattern in Forex
The hammer candlestick pattern is a valuable tool for forex traders, particularly when trying to spot potential reversals at the end of a downtrend. However, using this pattern effectively requires a clear process that goes beyond simple recognition. A structured approach helps reduce the chances of entering weak setups and allows traders to manage their positions with greater confidence. Below is a step-by-step breakdown of how to trade the hammer candlestick pattern in the forex market.
Identify the Hammer
The first step is to accurately identify the hammer on a price chart. This involves spotting a single candlestick with a small real body located at the upper end of the candle’s total range, paired with a long lower shadow that is at least twice the length of the body. The upper shadow should be very short or nonexistent. For the pattern to be meaningful, it must appear after a clear and visible downtrend. The trend context is important because it tells the story of recent market behavior and sets the stage for a possible reversal.
Confirm the Reversal
Once a hammer has formed, it’s important not to enter a trade immediately. The market needs to provide confirmation that the reversal is likely to occur. This typically comes in the form of the next candlestick closing above the high of the hammer. This follow-through by buyers adds credibility to the pattern and increases the chances that the shift in sentiment will continue. Without confirmation, the hammer could be a false signal or simply a momentary pause in a larger bearish trend.
Enter a Long Trade
After confirmation, a long trade can be considered. The actual entry may be placed just above the high of the confirmation candle or, in some cases, directly at the close of that candle. The goal is to catch the early stages of a bullish move while keeping risk limited. Entering the trade at the right moment ensures that the trader is acting on a validated signal rather than just reacting to a single candle formation.
Manage the Trade
Proper trade management is essential for capital preservation and long-term success. One of the advantages of the hammer pattern is that it provides a natural level for placing a stop-loss. Traders typically set the stop just below the low of the hammer candle, as a move below this level would suggest that the pattern has failed. The take-profit level can be determined using previous resistance zones, trendline projections, or by calculating a favorable risk-to-reward ratio—such as 1:2 or 1:3. Adjustments can also be made based on market volatility and current conditions.
Watch for Invalidation
No pattern is perfect, and every trade carries risk. If the price fails to follow through or drops below the hammer’s low after entry, this is a sign that the reversal has not taken hold. In such cases, it's important to respect the stop-loss and exit the trade promptly. Holding on to losing positions in hopes of recovery often leads to larger losses. Sticking to the plan and recognizing invalidation as a normal part of trading is key to consistent performance.
Analyze the Results
After the trade is closed—whether at a profit or loss—it's important to take a moment to review the entire setup. Was the hammer pattern valid? Was the confirmation strong enough? Did the trade follow the plan, and were there any mistakes made during execution? Answering these questions can provide valuable lessons for future trades. Over time, this habit of reviewing trades helps traders refine their approach, improve decision-making, and build a strategy that is both practical and adaptable.
Trading the hammer candlestick in forex is about more than just spotting a certain shape on a chart. It involves understanding market context, waiting for confirmation, managing risk, and learning from outcomes. When applied with discipline and care, the hammer pattern can become a powerful signal in a trader’s toolbox.
🔗 Tips
Tips for Trading with the Hammer Candlestick
- Use in Conjunction with Other Indicators: Combine the Hammer pattern with other technical analysis tools for confirmation.
- Consider Volume: Higher trading volume during the formation of the Hammer can add validity to the pattern.
- Be Mindful of Market Context: Assess the overall market trend and conditions before acting on the Hammer pattern.
🔗 Example
Example of a Hammer Candlestick Pattern
Imagine a forex pair in a downtrend. A Hammer candlestick forms, followed by a bullish candlestick that closes above the Hammer's high. This sequence suggests a shift in momentum from sellers to buyers. A trader recognizing this setup could have entered a long trade after confirmation, placing a stop-loss just below the Hammer’s low and aiming for a target at the next resistance level. This kind of scenario is common in markets like EUR/USD or GBP/USD, where daily volatility presents multiple opportunities for candlestick-based strategies.
Let’s examine an illustrative example using a candlestick chart setup:
Timeframe | Candle 1 (Hammer) | Candle 2 (Confirmation) | Entry | Stop Loss | Take Profit |
H4 | Long lower wick, small upper body | Closes above Hammer’s high | At break of Candle 2 | Below Hammer’s low | Previous resistance level |
This simple yet powerful pattern often helps traders catch early signs of reversals, especially when used with basic support and resistance analysis.
🔗 identify
How do you identify the Hammer Candlestick Pattern in technical analysis?
Identifying the hammer candlestick pattern involves a combination of visual recognition and market context. Here’s a structured approach:
- Scan for single candles with a small body near the top of the candle’s range.
- Ensure the lower shadow is at least twice the length of the body.
- Confirm that there’s little or no upper shadow.
- Place this formation in the context of a downtrend or decline — without a prior downtrend, it loses significance.
Some traders use automatic candlestick recognition tools within their charting software, but even manual identification is relatively simple once you train your eye.
Key characteristics to check:
Attribute | Requirement |
Real Body | Small, near the top of candle |
Lower Shadow | Long, 2x or more the size of the body |
Upper Shadow | Very small or nonexistent |
Position in Trend | Must appear after a downtrend |
🔗 accurate
How accurate is the Hammer Candlestick Pattern in Technical Analysis?
The accuracy of the hammer pattern is moderate to high — but it depends greatly on confirmation and context. A hammer alone is not a guarantee of a trend reversal. In backtests, hammer patterns with confirmation candles and additional filters (such as volume spike or RSI divergence) have shown a higher probability of success.
Let’s break down the Hammer’s statistical reliability:
Condition | Estimated Accuracy Rate |
Hammer without confirmation | 40–50% |
Hammer with confirmation | 60–70% |
Hammer at key support level | Up to 75% |
These numbers vary across markets and timeframes, but in general, the hammer becomes more effective when combined with proper trading context.
It’s also important to understand that like all candlestick patterns, the hammer is probabilistic. It should be viewed as one piece in a larger strategy rather than a standalone signal.
What are the advantages of a Hammer Candlestick?🔗 advantages
The hammer candlestick pattern offers several benefits that make it a valuable part of any trader’s technical analysis strategy. Whether used by beginners or experienced traders, the hammer provides visual clarity and practical application across various market conditions and instruments. Its distinct shape and the story it tells about price behavior can help traders identify potential opportunities with confidence and manage their risk more effectively.
Simple and visually intuitive
One of the most appealing aspects of the hammer candlestick is its simplicity. It has a clean, unmistakable shape that even new traders can learn to recognize with minimal training. The small real body positioned near the top of the candle, combined with a long lower shadow, makes it stand out clearly on a chart. This visual clarity reduces the chances of confusion and allows traders to quickly scan for potential setups without the need for complex indicators or software. The pattern’s visual nature makes it an excellent starting point for those just beginning to study candlestick analysis.
Early reversal signal
Another advantage of the hammer pattern is its ability to signal a potential market reversal before it becomes obvious. When it appears after a consistent downtrend, the hammer may indicate that selling pressure is fading and that buyers are starting to step in. This early warning allows traders to enter trades at more favorable prices, giving them the opportunity to ride the early stages of a bullish movement. For swing traders and intraday traders, catching the beginning of a trend reversal can offer a high reward-to-risk setup with relatively limited downside if managed correctly.
Versatile application
The hammer candlestick pattern is highly versatile and works well across a wide range of asset classes. It can be applied in forex trading, stock markets, commodity trading, cryptocurrencies, and indices. In addition to being effective across different markets, it also adapts well to various timeframes. Traders can use the hammer on intraday charts like 5-minute or 15-minute timeframes for quick trades, or they can apply it to higher timeframes such as daily or weekly charts for longer-term strategies. This adaptability means the pattern fits into almost any trading style, whether short-term scalping or long-term investing.
Clear risk management structure
A major benefit of the hammer pattern is that it naturally provides a logical area for stop-loss placement. Because the long lower shadow represents the lowest point of the trading session, placing a stop just below this level allows traders to define their risk clearly. This makes it easier to calculate position sizes and plan trades with precision. Having a built-in stop-loss level helps traders stick to their strategies and avoid emotional decision-making, especially in volatile markets.
Integration with other strategies
The hammer candlestick does not have to be used on its own. In fact, it becomes even more powerful when combined with other tools and techniques. For example, if a hammer forms near a known support level or Fibonacci retracement, the probability of a reversal increases. Traders also use it in conjunction with trendlines, moving averages, or momentum indicators like RSI or MACD to confirm signals. The pattern serves as a visual trigger that can complement larger technical or fundamental strategies, helping traders time their entries more effectively.
Advantage | Benefit |
Easy to identify | Saves time and reduces analysis paralysis |
Defined risk/reward | Stop-loss and target zones are clearly visible |
Works across assets | Usable in forex, crypto, commodities, and stocks |
Can precede major reversals | Helps traders get in at better prices |
🔗 disadvantages
What are the disadvantages of a Hammer Candlestick?
Despite being a popular and visually recognizable reversal pattern, the hammer candlestick has several limitations that traders should consider before relying on it exclusively.
One major drawback is that it can produce false signals. Just because the hammer has formed does not guarantee a reversal will happen. In some cases, the price may continue downward, making the hammer a trap for premature buyers.
Another disadvantage is that its reliability decreases when used in isolation. Without confirmation from subsequent candles or support from volume, support levels, or other indicators, the hammer may not provide a strong enough signal on its own.
Also, the pattern’s simplicity can be deceptive. Novice traders may begin to see hammers in any long lower wick candle, regardless of whether the market context justifies a potential reversal. This leads to poor trade entries based on weak setups.
Finally, the hammer is more effective in trending markets and less useful in ranging or choppy conditions, where it can frequently appear without any meaningful result.
Disadvantage | Explanation |
Can produce false signals | Hammer may not lead to reversal |
Context-dependent | Requires a downtrend to be valid |
Needs confirmation | Better when followed by a bullish candle |
Can be misidentified | Any long wick candle isn't a true hammer |
Less effective in ranges | Works best in trending environments |

Is Hammer Candlestick Pattern profitable?🔗 profitable
The hammer candlestick pattern can be profitable, especially when used as part of a comprehensive trading system. Its real value lies in the early indication of potential trend reversals, allowing traders to enter positions at favorable prices.
Profitability increases when the pattern is:
- Used with confirmation
- Aligned with a support level
- Combined with volume spikes or oscillators like RSI
However, no candlestick pattern guarantees profitability. The hammer must be used alongside proper risk management, including stop-loss placement and realistic profit targets. In backtests and live trades, the hammer has shown decent win rates, particularly on higher timeframes like the H4 or daily charts.
Profitability depends on the trader's discipline, the tools used for confirmation, and the context in which the pattern is traded.
Is a Hammer Candlestick Pattern Bullish or Bearish?🔗 Bullish
The hammer candlestick pattern is primarily regarded as a bullish signal. Its structure reflects a scenario where sellers were initially in control of the market, pushing prices lower during the session. However, buyers stepped in with strength, reversing most or all of the losses and forcing the price to close near its opening level. This shift in intraday sentiment is what gives the hammer its bullish character—it represents a possible turning point where selling momentum weakens, and buying interest begins to build.
The bullish nature of the hammer becomes especially relevant when the pattern appears after a sustained downtrend. In this context, the market has been experiencing steady declines, and participants may be looking for signs of exhaustion from the selling side. The hammer’s long lower shadow shows that sellers attempted to extend the downtrend, but failed, as buyers reclaimed control before the close. This failure to maintain new lows, combined with a strong recovery, can serve as an early indication that the downtrend is losing steam and that a potential reversal to the upside may be forming.
Despite its generally bullish implication, the same visual pattern can have an entirely different meaning if it forms in a different context. When a candle with the same shape appears after an uptrend, it is no longer called a hammer—it becomes known as a hanging man. Though visually identical, the hanging man carries a bearish interpretation, suggesting that the market may be running out of upward momentum. In this case, the long lower shadow shows a sharp sell-off during the session, which raises concerns about the strength of the existing uptrend, even if the price eventually closed near its opening level.
This contrast underscores a key principle in technical analysis: the meaning of a candlestick pattern is not determined by its shape alone, but also by where it occurs within the broader price action. A hammer pattern at the bottom of a downtrend is a potential bullish reversal signal. A similar candle at the top of an uptrend, however, could be a warning sign of weakness.
Therefore, while the hammer candlestick is typically bullish, traders should always evaluate it in the context of the prevailing trend. By doing so, they can avoid misinterpreting the pattern and make better-informed trading decisions. Understanding both the formation and its location within the market structure is essential for using the hammer pattern effectively.
Pattern Name | Location | Implication |
Hammer | After downtrend | Bullish |
Hanging Man | After uptrend | Bearish |
🔗 other
What are other Types of Candlestick besides Hammer?
Candlestick analysis includes many patterns beyond the hammer. Each pattern has its own structure, meaning, and context. Some patterns are used for spotting reversals, while others confirm continuation.
Doji
A doji candlestick forms when the open and close prices are very close or equal. It indicates indecision in the market and can suggest a potential reversal or pause, depending on the context.
Spinning Tops
Spinning tops have small real bodies and upper and lower shadows of similar length. They reflect indecision between buyers and sellers and usually occur in sideways or consolidating markets.
Engulfing Pattern
An engulfing pattern consists of two candles. In a bullish engulfing pattern, a small red candle is followed by a larger green candle that completely engulfs the previous candle’s body. It signals a strong shift in momentum.
Morning and Evening Stars
The morning star is a bullish three-candle pattern that signals the end of a downtrend. The evening star is its bearish counterpart and indicates the end of an uptrend.
Three White Soldiers and Three Black Crows
Three white soldiers is a strong bullish reversal pattern consisting of three long green candles. Three black crows is the bearish version, with three long red candles signaling a potential downtrend.
Pattern Name | Signal Type | Description |
Doji | Neutral | Market indecision |
Spinning Tops | Neutral | Balance between bulls and bears |
Engulfing | Reversal | Second candle overtakes the first |
Morning Star | Bullish | Three-candle bullish reversal |
Evening Star | Bearish | Three-candle bearish reversal |
Three White Soldiers | Bullish | Strong buying momentum |
Three Black Crows | Bearish | Strong selling momentum |
What is the difference between a Hammer Candlestick Pattern and a Doji Candlestick Pattern?
The hammer and doji patterns are both single-candle formations, but they convey different messages and have different structures.
A hammer has a small body and a long lower shadow, with little or no upper wick. It shows that price dropped significantly but buyers pushed it back up, indicating buying strength.
A doji, on the other hand, has little to no real body because the open and close prices are almost the same. It shows indecision, where neither buyers nor sellers are in control.
Feature | Hammer | Doji |
Real Body | Small, top of range | Very small or nonexistent |
Lower Shadow | Long | Can vary |
Upper Shadow | Small or none | Can vary |
Signal | Reversal (bullish) | Indecision |
What is the difference between a Hammer Candlestick Pattern and an Inverted Hammer Candlestick Pattern?
The inverted hammer and the hammer share a similar market meaning but have opposite shapes.
While the hammer has a long lower shadow and small body at the top, the inverted hammer has a long upper shadow and small body near the bottom.
Both form after downtrends and signal a potential reversal. The inverted hammer suggests that bulls tried to push prices higher but faced resistance. If the next candle is bullish, it confirms a reversal.
Feature | Hammer | Inverted Hammer |
Long Shadow | Lower | Upper |
Appears In | Downtrend | Downtrend |
Confirmation | Needed with bullish candle | Needed with bullish candle |
Interpretation | Buyers gained control | Buyers tested the market |
🔗 Limitations
Limitations of a Hammer Candlestick
While the hammer candlestick pattern is widely used and can offer valuable insights into potential market reversals, it also comes with several important limitations. These limitations can affect the pattern’s reliability, especially when it is used without additional context or supporting tools. Understanding these drawbacks is essential for applying the pattern effectively and avoiding false signals.
One of the primary limitations of the hammer pattern is that it requires confirmation from subsequent price action. A single hammer by itself does not provide enough evidence that a trend reversal will occur. Without a follow-up bullish candle that closes above the high of the hammer, the pattern may simply reflect temporary buying interest rather than a lasting shift in momentum. Relying on the hammer alone can lead to premature entries, particularly in volatile or uncertain markets.
Another limitation is the frequency with which hammers can appear in ranging or sideways markets. During periods of low momentum or unclear direction, hammer-shaped candles may form often, but they rarely lead to sustained reversals. In such cases, the pattern loses its effectiveness and can become a source of confusion rather than a useful signal. Traders may be tempted to take positions based on these frequent occurrences, only to experience whipsaws or choppy price action that results in losses.
The hammer also does not provide any information about the potential size, speed, or duration of the following move. Even when it correctly signals a reversal, the resulting price movement might be small or short-lived. This lack of predictive power makes it difficult to estimate reward potential, which can be a challenge for traders trying to set profit targets or determine whether the trade is worth taking in the first place.

Misinterpretation is another common issue, especially among beginners. Because the hammer looks relatively simple, newer traders may wrongly identify any candle with a long lower shadow as a hammer. This can lead to poor decision-making based on patterns that do not meet all the necessary criteria. Misreading candles in this way can result in entering trades in the wrong context or failing to apply proper confirmation techniques.
Lastly, the hammer is not designed to be used in isolation. It is a part of the broader technical analysis toolkit and is most effective when combined with other forms of analysis. Without support from additional tools—such as trendlines, moving averages, volume indicators, or key support and resistance levels—the hammer’s signals can be weak and unreliable. Traders who ignore the broader market structure or use the hammer without supporting evidence may end up basing their trades on incomplete information.
To address these limitations, traders often use the hammer pattern alongside other technical tools. For example, if a hammer forms at a major support level, near a rising trendline, or with an accompanying increase in volume, it becomes a much stronger and more trustworthy signal. Confirmation from oscillators like RSI or MACD can also add credibility to the pattern. By combining the hammer with a well-rounded strategy, traders can improve their decision-making and avoid the common pitfalls associated with using this pattern in isolation.
🔗 FAQ
FAQ
Can the hammer candlestick appear in any market?
Yes. It can appear in forex, crypto, stocks, commodities, and indices. It works the same way in all liquid markets.
Does the hammer pattern always mean a reversal?
Not always. It increases the probability of a reversal, but confirmation is needed.
Which timeframe is best for the hammer pattern?
H4 and daily timeframes generally produce more reliable signals, but it can be used on any timeframe.
Can the hammer be used in scalping?
Yes, but on lower timeframes, false signals are more common. Use tight stop losses.
What is the best indicator to combine with a hammer?
Support/resistance levels, RSI divergence, and volume spikes are commonly used alongside the hammer.
Is it better to automate hammer pattern trading?
Automation can help scan markets faster, but human context and judgment remain valuable.
What if the hammer candle is red?
It’s still valid if the body is small and positioned at the top with a long lower wick. The color matters less than structure.
Go Back Go Back
