In the fast-paced world of stock trading, few opportunities generate as much excitement as breakout stocks. These are the stocks that suddenly surge past key price levels, catching the attention of traders and investors alike. A well-timed move on a breakout can yield impressive returns in just minutes or days, making them a favorite among momentum traders. But with the thrill of potential profits comes the danger of getting caught in false breakouts—those frustrating moments when a stock moves just enough to bait traders, only to retreat sharply. Still, the potential rewards are too tempting to ignore, and for many market participants, breakout stocks remain one of the most exhilarating ways to stay ahead of the curve.
Table of Contents
Why Are Breakout Stocks Important?
What Breakout Indicators Can Be Used?
How to Place Stop-Loss and Take-Profit After a Stock Breakout
Why is NIFTY 50 Important for Breakout Stocks?
Advantages and Disadvantages of Breakout Stocks
Frequently Asked Questions (FAQ)
Key Takeaways
- Breakout stocks occur when a stock's price moves beyond a defined support or resistance level with increased volume.
- Breakouts can signal the start of a new trend, offering potential for significant profits.
- False breakouts are common and can lead to losses; confirmation through volume and other indicators is crucial.
- Indicators like moving averages, RSI, and Bollinger Bands can help identify potential breakouts.
- Risk management strategies, including stop-loss and take-profit orders, are essential when trading breakout stocks.
🔗 what
What Are Breakout Stocks?
Breakout stocks are those that exhibit a sharp price movement beyond well-defined support or resistance levels on a price chart. These movements are typically accompanied by a noticeable surge in trading volume, signaling heightened market interest and possibly the beginning of a new trend. Support and resistance levels are psychological price zones where buying or selling pressure historically prevented further movement. When a stock breaks through one of these zones, it often indicates that the previous balance of power between buyers and sellers has shifted.
For instance, imagine a stock that has consistently traded between $50 and $60 for several weeks or even months. This range forms a clear horizontal channel, with $50 acting as support and $60 as resistance. If the stock suddenly pushes above the $60 level on strong volume, it is viewed as a breakout. This move suggests that buying pressure has overwhelmed the previous selling resistance at that level. Traders often consider such a breakout a bullish signal and may enter long positions with the expectation that the upward momentum will continue and drive the stock to new highs.
Breakouts can also occur to the downside. If the same stock were to fall below the $50 support level, it could be interpreted as a bearish breakout, prompting short sellers to enter the market in anticipation of further declines. Whether bullish or bearish, breakouts are valued because they present a clear setup with defined entry and exit points based on historical price behavior.
However, breakout trading is not without risk. Not every breakout results in a sustained move. In some cases, the price may briefly push through a level only to reverse course—this is known as a false breakout. False breakouts can occur due to market manipulation, lack of follow-through buying or selling, or misinterpretation of news events. These can be especially dangerous for traders who enter positions too quickly without confirmation.
To reduce the likelihood of being caught in a false breakout, seasoned traders rely on confirmation signals such as a retest of the breakout level, momentum indicators like RSI or MACD, and—most importantly—trading volume. High volume during a breakout generally suggests that institutional investors are participating, which adds credibility to the move.
Ultimately, breakout stocks represent a powerful concept in technical analysis and a favorite approach among short-term and swing traders. With proper tools, patience, and risk management, breakouts can offer high-probability trade setups and potentially lucrative returns.
🔗 why
Why Are Breakout Stocks Important?
Breakout stocks capture the attention of traders and analysts because they often mark the beginning of a new price phase. When a stock breaks out of a long-standing range, it's not just a technical event—it can be a sign of shifting market dynamics, a response to new fundamental data, or a change in investor sentiment. These shifts can turn previously stagnant stocks into momentum leaders, offering a front-row seat to fast-moving opportunities.
One key reason breakout stocks are important is their psychological impact on the market. Breakouts often trigger emotional reactions—fear of missing out (FOMO) among buyers or panic among short-sellers caught on the wrong side of the trade. These emotional drivers can fuel rapid price expansion far beyond what fundamentals might suggest in the short term. As a result, breakout stocks tend to attract more liquidity, making it easier for traders to enter and exit positions efficiently.
Breakout movements can also serve as validation of broader market themes. For example, if several stocks within the same sector break out simultaneously, it may signal that institutional investors are rotating capital into that sector. Traders and fund managers often monitor these coordinated breakouts to adjust their own strategies, making breakout stocks valuable not only as individual trades but also as market indicators.
Additionally, breakout stocks are commonly used by quantitative and algorithmic trading systems. These systems are programmed to identify price action anomalies—such as a breakout beyond a resistance level—and execute trades based on statistical probabilities. This automation adds volume and momentum to breakouts, reinforcing their importance in modern markets.
From a strategic standpoint, breakout stocks offer a level of clarity that appeals to both novice and experienced traders. Unlike trend-following strategies that may leave traders guessing about optimal entry points, breakouts often provide well-defined signals based on objective price levels. This clarity simplifies decision-making, which is especially useful in volatile or fast-moving markets.
In essence, breakout stocks are more than just opportunities for quick profits. They represent moments when the market reveals its hand—moments when price, volume, and psychology align to create the potential for powerful moves. For those able to recognize and act on these moments with discipline and precision, breakout stocks can be a valuable tool in any trading arsenal.
🔗 Examples
Examples of Breakout Stocks
Several well-known companies have experienced breakout movements, providing traders with profitable opportunities. Here are a few examples:
Company | Ticker | Breakout Date | Breakout Level | Post-Breakout High |
Apple Inc. | AAPL | Jan 2020 | $300 | $400 |
Tesla Inc. | TSLA | Aug 2020 | $500 | $900 |
Amazon.com Inc. | AMZN | Apr 2020 | $2,400 | $3,500 |
Nvidia Corp. | NVDA | May 2023 | $310 | $500 |
Meta Platforms Inc. | META | Feb 2023 | $180 | $320 |
Reliance Industries | RELIANCE | Jul 2020 | ₹2,000 | ₹2,400 |
Tata Consultancy Services | TCS | Feb 2021 | ₹3,200 | ₹3,950 |
Infosys Ltd. | INFY | Oct 2020 | ₹1,100 | ₹1,400 |
HDFC Bank Ltd. | HDFCBANK | Dec 2020 | ₹1,400 | ₹1,650 |
Bajaj Finance Ltd. | BAJFINANCE | Jun 2021 | ₹5,600 | ₹7,800 |
ICICI Bank Ltd. | ICICIBANK | Oct 2021 | ₹720 | ₹920 |
Adani Enterprises Ltd. | ADANIENT | May 2022 | ₹2,200 | ₹4,000 |
Tata Motors Ltd. | TATAMOTORS | Sep 2021 | ₹340 | ₹540 |
Larsen & Toubro Ltd. | LT | Aug 2023 | ₹2,400 | ₹3,200 |
Hindustan Unilever | HINDUNILVR | Apr 2020 | ₹2,000 | ₹2,500 |
These breakouts were often driven by strong earnings reports, product launches, or broader market trends. Traders who identified these breakouts early and managed their risk appropriately could have realized significant profits.
🔗 Strategy
What Is a Breakout Strategy?
A breakout strategy is a trading approach built on the idea that when a stock’s price escapes a well-defined trading range, it often signals the beginning of a new directional move—either upward or downward. This strategy seeks to take advantage of the momentum that follows such a breakout, positioning traders early in the move to capture as much of the price trend as possible. Breakout strategies are based on the belief that price consolidations are periods of indecision, and once a breakout occurs, it reflects a shift in supply and demand that can drive substantial price changes.
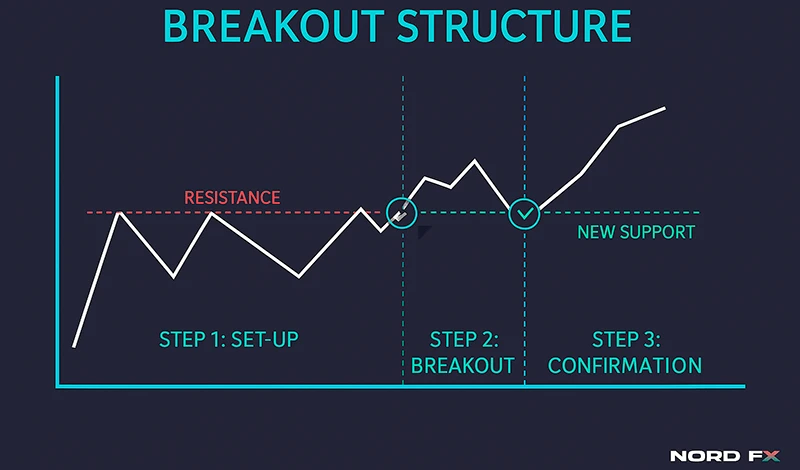
At its core, a breakout strategy follows a structured and disciplined set of steps:
- Identify Key Levels: Traders begin by analyzing charts to find consistent support (a level where price historically bounces up) and resistance (a level where price repeatedly gets rejected). These levels form the foundation of the strategy. Consolidation patterns such as triangles, flags, rectangles, and channels are closely watched for potential breakouts.
- Monitor Volume: Volume is a crucial indicator in breakout trading. A surge in volume as the price approaches a support or resistance level often indicates growing interest and potential for a sustained move. Volume confirms whether a breakout is likely to hold or fade. A breakout on low volume, for instance, is often treated with skepticism.
- Confirm the Breakout: Before jumping in, experienced traders wait for the breakout to be confirmed. This could mean waiting for a full candlestick close above resistance (in a bullish breakout) or below support (in a bearish breakout). Some traders also look for a retest of the broken level, where price temporarily pulls back to test the old support or resistance as a new support or resistance.
- Enter the Trade: Once confirmation is in place, the trader enters the trade in the direction of the breakout. The entry can be aggressive (immediately on the breakout) or conservative (after a retest or confirmation over multiple timeframes). The chosen method often depends on the trader’s risk tolerance and market conditions.
- Set Stop-Loss and Take-Profit Orders: Managing risk is just as important as identifying the breakout. Stop-loss orders are typically placed just below the breakout level in bullish trades or above it in bearish trades. Take-profit targets are determined based on the size of the prior trading range, key Fibonacci extensions, or recent price structure.
Breakout strategies are highly adaptable. Day traders might use them on minute or hourly charts to capture quick intraday moves, while swing traders and investors may rely on daily or weekly charts to capture longer-term trends. Regardless of the timeframe, the psychology is the same: when price breaks out of an area where it has spent considerable time consolidating, it tends to move decisively in the direction of the breakout.
Furthermore, breakout strategies can be applied not only to price levels but also to indicators. For example, a breakout from a range in RSI or MACD can also be used as a supporting signal for entering trades.
While powerful, breakout strategies do require discipline and patience. Many new traders jump into trades the moment a breakout begins, only to see it reverse moments later. That’s why confirmation, volume analysis, and strict risk control are essential components of a successful breakout trading system. When executed correctly, breakout strategies offer some of the clearest and most lucrative setups in technical trading.
Is Breakout Bullish or Bearish?
Breakouts can be either bullish or bearish, depending on the direction of the price movement:
- Bullish Breakout: Occurs when the price moves above a resistance level, suggesting the start of an upward trend. Traders may enter long positions in anticipation of further price increases.
- Bearish Breakout: Happens when the price falls below a support level, indicating a potential downward trend. Traders might initiate short positions, expecting the price to continue declining.
Understanding the context and confirming the breakout with additional indicators and volume analysis is crucial to determine the breakout's direction and potential strength.
🔗 Avoid
How to Avoid False Breakouts
False breakouts are one of the biggest challenges traders face when working with breakout strategies. These misleading price moves often create the illusion of a strong directional shift, only to reverse sharply and leave traders trapped in losing positions. Beyond the standard practices of confirmation, volume analysis, technical indicators, and stop-loss placement, there are additional tactics and psychological considerations that can help traders filter out noise and stay on the right side of the market.
Understand the Timing of Breakouts
Not all breakouts occur at optimal times. Breakouts that happen during low-liquidity hours—such as the first or last few minutes of the trading day, or during lunch hours—are often less reliable. These moves are more likely to be triggered by fewer participants and can easily be manipulated or reversed. In contrast, breakouts during periods of high institutional activity (like during major market opens or after economic news releases) tend to be more robust and sustained.
Watch for Trap Candles and Fakeout Patterns
Certain candlestick formations can signal that a breakout is suspect. For instance, if a price breaks above resistance and then forms a long upper wick (e.g., a shooting star or bearish engulfing candle), it may indicate exhaustion and a possible reversal. Similarly, if a stock gaps up above resistance but quickly falls back within the range, this “gap and trap” scenario can be a classic fakeout. Paying close attention to candlestick behavior after a breakout can give subtle clues about market conviction.
Use the "Look Left" Principle
Always analyze historical price action. A level that appears to be resistance on a short timeframe may already have been broken several times in the past. If a level has been tested too often, its strength may be weakened, making a breakout more likely to fail. Conversely, levels that have not been tested in months or years can be more meaningful. “Looking left” helps confirm whether a breakout is occurring in truly uncharted territory or merely within a noisy, congested range.
Track News Catalysts and Sentiment Shifts
Fundamental context plays a key role in whether a breakout is likely to succeed. If a stock breaks out following a positive earnings report, product launch, or upgrade from a major analyst, the move is more likely to attract sustained buying interest. On the other hand, breakouts that occur without a clear catalyst may lack follow-through. Traders who align technical breakouts with news catalysts and prevailing sentiment tend to have an edge.
Use Multi-Timeframe Analysis
One of the most underused techniques in avoiding false breakouts is analyzing multiple timeframes. A breakout on a 5-minute chart might look promising, but zooming out to the hourly or daily chart might reveal that the move is happening within a broader downtrend. By ensuring that the breakout is supported across timeframes, traders can avoid acting on signals that are only relevant within narrow windows.
Measure the Quality of the Consolidation
Before a breakout occurs, many stocks spend time consolidating in a tight range. The nature of this consolidation can provide clues about the breakout’s strength. A tight, orderly range with diminishing volume often precedes a stronger move. In contrast, messy ranges with large wicks, wide spreads, and inconsistent volume are more prone to producing false breakouts. A clean base is often the foundation for a clean breakout.
Observe Market Context and Correlations
Sometimes the broader market can help confirm or contradict a breakout. For example, if a tech stock breaks out while the NASDAQ is also surging, the move is more likely to hold. But if the breakout happens in isolation, while the sector or index is showing weakness, it could be a setup for a fakeout. Watching correlated assets or sector indices can add another layer of confidence to a trade setup.
By integrating these additional layers of analysis—timing, candlestick behavior, historical context, fundamental triggers, multi-timeframe alignment, consolidation quality, and market correlations—traders gain a much deeper toolkit for filtering out false breakouts. Avoiding traps isn't just about using indicators; it's about reading the story the market is telling and knowing when that story doesn’t add up.
🔗 Used
What Breakout Indicators Can Be Used?
Several technical indicators can help identify potential breakouts and confirm their validity:
- Moving Averages: Simple Moving Averages (SMA) and Exponential Moving Averages (EMA) can highlight trends and potential breakout points.
- Bollinger Bands: When the price moves beyond the upper or lower band, it may indicate a breakout.
- Relative Strength Index (RSI): Measures the speed and change of price movements; extreme values can signal potential breakouts.
- MACD (Moving Average Convergence Divergence): Identifies changes in momentum that may precede breakouts.
- Volume Indicators: High volume during a price move can confirm the strength of a breakout.
Using a combination of these indicators can provide a more comprehensive view of the market and increase the likelihood of successfully identifying and trading breakouts.
For a visual explanation of breakout strategies, you can watch this video.
🔗 Place
How to Place Stop-Loss and Take-Profit After a Stock Breakout
In breakout trading, setting appropriate stop-loss and take-profit levels is crucial for effective risk management and profit realization.
Setting Stop-Loss Orders
- Below Support Levels: Place stop-loss orders just below the breakout point or recent support level to limit potential losses if the breakout fails.
- Volatility Consideration: Adjust stop-loss distances based on the stock's volatility; more volatile stocks may require wider stop-loss margins.
- Trailing Stops: Implement trailing stop-loss orders that adjust with the stock's price movement, securing profits while allowing for potential gains.
Establishing Take-Profit Targets
- Risk-Reward Ratio: Aim for a favorable risk-reward ratio, such as 1:2 or 1:3, meaning the potential profit is two to three times the potential loss.
- Technical Indicators: Use technical analysis tools like Fibonacci extensions or previous resistance levels to set realistic take-profit points.
- Partial Profit Taking: Consider taking partial profits at certain milestones to secure gains while keeping a position open for further upside.
🔗 NIFTY
What is NIFTY 50?
The NIFTY 50 is a benchmark stock market index representing the weighted average of 50 of the largest Indian companies listed on the National Stock Exchange (NSE).
Key Features
- Diverse Sectors: Includes companies from various sectors, providing a comprehensive view of the Indian economy.
- Market Capitalization: Constituents are selected based on free-float market capitalization, ensuring liquidity and market representation.
- Economic Indicator: Serves as a barometer for the Indian stock market and overall economic health.

🔗 Stocks
Why is NIFTY 50 Important for Breakout Stocks?
The NIFTY 50 index plays a significant role in identifying breakout stocks within the Indian market.
Significance
- Market Sentiment: Movements in the NIFTY 50 reflect investor sentiment, aiding in the identification of potential breakout opportunities.
- Benchmarking: Traders use the index as a benchmark to compare individual stock performances and identify outliers exhibiting breakout patterns.
- Liquidity Indicator: High liquidity in NIFTY 50 stocks ensures smoother execution of trades during breakouts.
🔗 Advantages
Advantages and Disadvantages of Breakout Stocks
Advantages
- High Profit Potential: Breakouts can lead to significant price movements, offering substantial profit opportunities.
- Clear Entry Points: Defined support and resistance levels provide clear signals for trade entries.
- Momentum Trading: Breakout stocks often exhibit strong momentum, allowing traders to capitalize on rapid price changes.
Disadvantages
- False Breakouts: Not all breakouts lead to sustained trends; some may reverse, leading to potential losses.
- Market Volatility: Breakout trading can be challenging in highly volatile markets, increasing the risk of premature stop-loss triggers.
- Requires Discipline: Successful breakout trading necessitates strict adherence to trading plans and risk management strategies.
🔗 FAQ
Frequently Asked Questions (FAQ)
Q1: What is a breakout stock?
A breakout stock is one that moves beyond a defined support or resistance level, often accompanied by increased volume, signaling the potential start of a new trend.
Q2: How can I identify a breakout stock?
Look for stocks approaching key support or resistance levels with increasing volume. Technical indicators like moving averages and RSI can aid in confirmation.
Q3: Are breakouts always reliable indicators of trend changes?
Not always. Some breakouts may be false, where the price moves beyond a level but quickly reverses. It's essential to use additional indicators and risk management strategies.
Q4: What is the best time frame for breakout trading?
Breakout trading can be applied to various time frames, from intraday to long-term charts. The choice depends on your trading style and objectives.
Q5: How important is volume in breakout trading?
Volume is crucial. A breakout accompanied by high volume is more likely to be genuine, indicating strong market interest.
Note: The information provided in this article is for educational purposes only and does not constitute financial advice. Always conduct your own research and consult with a financial advisor before making investment decisions.
Kembali Kembali
