Trading economics is a multidimensional approach that uses macroeconomic indicators, economic calendars, and market data to inform trading decisions across forex, stocks, cryptocurrencies, and commodities. It equips traders with insights into how interest rates, employment statistics, GDP releases, inflation, and central bank policies drive market dynamics in modern financial markets.
Table of Contents
Key Economic Indicators That Move Markets
Trading Strategies Based on Trading Economics
Common Pitfalls in Interpreting Economic Data
Advantages of Trading Economics
Disadvantages of Trading Economics
Key Takeaways
- Trading economics blends economic statistics, forecasts, and calendar events to anticipate market moves.
- Understanding interest rates, inflation, employment, GDP, retail sales, trade balance, and similar indicators is essential.
- Economic calendars help spot high-impact events and plan trades.
- Strategies include trading around releases, positioning on surprise data, and using macro cycles to guide direction.
🔗 What
What Is Trading Economics?
Trading economics is a systematic approach to financial trading that focuses on interpreting macroeconomic data to make informed decisions in the markets. This data includes key economic indicators such as gross domestic product (GDP), inflation rates, interest rate decisions from central banks, employment statistics, retail sales figures, trade balances, and more. These metrics reflect the underlying health and direction of a country’s economy and can significantly influence the behavior of various financial instruments, including currencies, stock indices, bonds, and commodities.
Unlike purely technical traders who rely on chart patterns, indicators, and historical price action, those who use trading economics incorporate a broader view of how economies function and evolve. They aim to align their trades with fundamental economic trends and the expected market reactions to newly released data. For instance, a higher-than-expected inflation reading might lead traders to anticipate tighter monetary policy, which could strengthen the domestic currency or weaken interest rate–sensitive assets like technology stocks.

This approach is highly adaptable and used by a wide range of market participants. Discretionary traders may use economic releases to guide their day-to-day decisions, while long-term investors might adjust their portfolios based on shifts in central bank policy or economic growth outlooks. Swing traders often look for short- to medium-term opportunities around high-impact economic events. Algorithmic and quantitative traders may even program models to respond automatically to deviations in economic data from forecasted expectations.
Trading economics matters because macroeconomic indicators are among the most powerful market-moving catalysts. Scheduled data releases—such as interest rate decisions, employment reports, or GDP figures—can trigger large price swings, particularly in high-liquidity markets like forex, commodities, and stock indices. Markets react not just to the actual numbers, but to how they compare to forecasts and previous readings. A surprise in the data can lead to sharp rallies or sell-offs as traders quickly adjust their positions in response to new information.
By understanding the context, timing, and market expectations around economic data, traders can anticipate volatility more effectively and position themselves accordingly. This helps improve decision-making, reduce guesswork, and enhance the potential for profit in both trending and volatile environments.
🔗 History
History of Trading Economics
The use of economic data in financial markets has evolved significantly over the past century. The foundations of trading economics can be traced back to the early 20th century, particularly following the economic upheaval caused by the Great Depression in the 1930s. During this time, economists and policymakers began to recognize the importance of systematic data collection and analysis to understand and manage national economies. This led to the formalization of macroeconomics as a field and the development of standardized economic indicators, such as unemployment rates, gross domestic product (GDP), and inflation indexes.
In the post-World War II era, many governments began publishing regular economic reports. These data releases allowed traders and investors to form expectations about the future direction of interest rates, inflation, and overall economic growth. As the role of central banks expanded, especially in managing inflation and employment through monetary policy, their communications and decisions became critical market-moving events. Traders started to analyze these reports and central bank statements to anticipate policy shifts and adjust their market positions accordingly.
By the 1980s, professional traders on Wall Street and other major financial centers routinely incorporated macroeconomic data into their trading strategies. However, access to real-time information was limited to institutional players with subscriptions to expensive terminals or direct lines to economic data feeds.
The 1990s and early 2000s marked a major turning point with the rise of the internet and electronic trading platforms. Economic data became more accessible to a broader audience as government websites and financial news providers began publishing releases online. Real-time economic calendars emerged, offering traders a centralized view of upcoming events, forecasts, and past results. These tools made it easier to anticipate periods of volatility and align trading strategies with the timing of economic announcements.
Simultaneously, globalization increased the interconnection between economies and markets, which heightened the importance of understanding not just domestic economic conditions, but also those of other major economies. Traders began tracking indicators from the United States, Eurozone, China, Japan, and emerging markets, as their influence on global assets—such as currencies, commodities, and indices—grew stronger.
Data aggregation platforms began compiling economic statistics from around the world into comprehensive databases. These platforms enabled traders to compare historical trends, monitor multiple economies at once, and analyze cross-country correlations with greater speed and accuracy. Advanced tools allowed users to chart data, run statistical analyses, and even build predictive models.
In recent years, trading economics has continued to evolve with the rise of algorithmic and data-driven trading strategies. Economic data feeds are now integrated directly into trading platforms, and some traders use automated systems to respond to releases in milliseconds. Meanwhile, retail traders have gained access to professional-grade tools, allowing them to follow economic events in real time, interpret data in context, and build strategies that once required institutional-level infrastructure.
As the speed and complexity of markets have increased, so too has the role of trading economics. Today, it serves not only as a foundation for fundamental analysis but also as a critical component of both short-term trading and long-term investment decision-making across global financial markets.
🔗 How
How Trading Economics Works
At its core, trading economics proceeds through several steps and components:
Economic Calendar Planning
Traders view upcoming scheduled data releases—such as central bank rate decisions, CPI inflation, employment figures, GDP prints—to map risk windows and plan exposure. Economic Calendar offers filters by importance, currency, and time zone, and assigns “impact” stars for volatility potential.
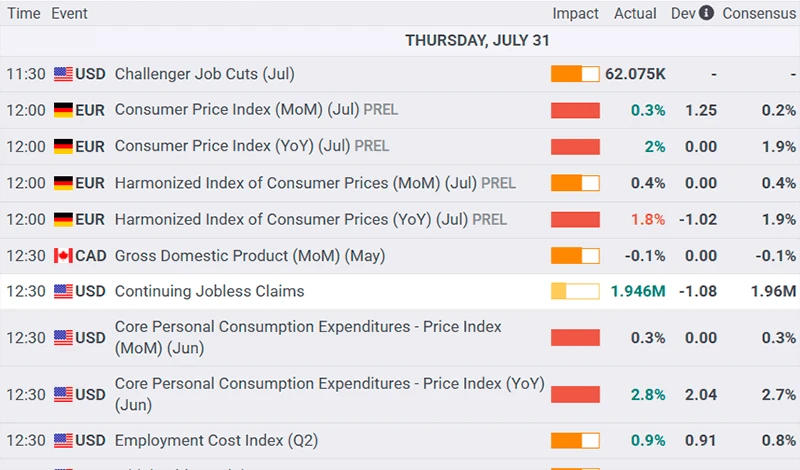
Forecast vs. Actual Comparison
Each indicator is published with a forecast (market consensus) and previous value. After release, the actual figure is compared to both. Surprises—especially binary shocks above or below expectations—trigger sharp moves.
Market Reaction Monitoring
Depending on the outcome, traders execute strategies such as entering in direction of surprise, fading overreaction, or holding through volatility. Markets often price in expectations in advance, so sometimes “bad news is interpreted as good” if the surprise is less negative than feared.
Macro Narratives & Correlation Analysis
Traders contextualize single indicators within broader macro trends (e.g. inflation slowing but still above target, labor market tightness persisting). They analyze how different asset classes correlate with indicators—e.g. USD forex pairs, bond yields, equities, commodities.
Integration with Technicals or Automated Systems
Some traders combine economic triggers with technical confirmation. Others feed indicators into algorithmic strategies or Expert Advisors. Platforms like MT5 support custom scripts and signals tied to economic news.
In essence, trading economics is a structured process of anticipating, reacting to, and positioning around economic information flow.
🔗 Key
Key Economic Indicators That Move Markets
Certain macro indicators consistently generate market movements, particularly in high‑liquidity instruments like forex pairs (EUR/USD, USD/JPY), indices, commodities (gold, oil), and sometimes crypto.
Major Indicators:
Indicator | What It Measures | Typical Market Reaction |
Interest Rate Decisions | Central bank policy rate changes | Rate hikes strengthen currency; cuts weaken it |
Consumer Price Index (CPI) / Producer Price Index (PPI) | Inflation trends | High inflation → hawkish bets → higher yields, stronger currency |
Employment (e.g. NFP, Unemployment Rate) | Labor market health | Strong jobs = stronger currency, stocks; weak triggers dovish sentiment |
GDP Growth | Economic expansion or contraction | Higher than expected GDP → equities up, currency strengthens |
Retail Sales / Consumer Confidence | Consumer spending strength | Upside surprises boost equities and domestic currency |
Trade Balance / Current Account | International trade flows and capital balances | Surpluses support currency; deficits may pressure it |
Manufacturing/Services PMI | Early economic activity gauge | PMI above 50 = expanding → bullish; below = bearish |
These indicators influence market psychology not only through levels, but also through surprises relative to consensus.
Effectively applying trading economics requires a reliable set of tools that help traders access, interpret, and react to economic data in a timely and structured way. These tools are essential for staying ahead of market-moving events and aligning trades with macroeconomic trends.
Economic Calendars
An economic calendar is one of the most essential resources for any trader using fundamental data. It provides a schedule of upcoming economic events, including interest rate decisions, employment reports, inflation figures, and other key releases. These calendars typically display the date and time of each event, the affected currency or country, the previous value, the forecast, and the actual figure once released. Many calendars also include a volatility rating system, often using symbols such as stars to indicate the likely market impact.
Traders can filter the calendar by importance level, region, and time zone to match their specific strategy and trading hours. This allows them to plan ahead and prepare for periods of potential volatility or trading opportunities.
Analytics and Commentary
In addition to raw data, traders benefit from expert commentary and analytical tools that explain how economic indicators might influence market sentiment. These tools help bridge the gap between information and interpretation, offering context that can refine trading decisions. Some platforms provide heat maps, sentiment indicators, and real-time updates that help traders see how the market is reacting to specific economic events.
Data Aggregation and Visualization
Global data aggregators compile economic statistics from a wide range of countries and present them in accessible formats. These platforms often include interactive charts, historical timelines, and downloadable datasets. Traders can use these resources to analyze macroeconomic trends over time, compare multiple economies, or build custom models based on economic cycles and performance.
Charting and Trading Platforms
Trading platforms such as MetaTrader 4 and MetaTrader 5 provide integrated charting tools and real-time price feeds, allowing traders to combine economic analysis with technical strategies. These platforms support a wide range of indicators and timeframes, as well as the ability to program Expert Advisors (EAs) that execute trades based on custom rules—including reactions to economic news.
MT4 and MT5 also offer backtesting features, which enable traders to test their strategies against historical data. This is particularly useful for assessing how markets responded to past economic releases and fine-tuning rules for future trades.
News and Alerts
Timely information is critical when trading around economic releases. Subscribing to news alerts for central bank statements, inflation reports, policy announcements, and geopolitical events helps traders stay updated. Real-time news feeds, push notifications, and RSS readers are useful tools for monitoring developments as they happen, especially when trading short-term volatility.
Demo and Simulation Tools
Practicing with demo accounts allows traders to simulate trading during real-time economic releases without risking capital. This helps build experience with managing slippage, spreads, and execution delays during high-impact events. Simulation tools can also be used to replay historical market conditions around key announcements, providing a risk-free environment to refine timing and reaction strategies.
By using these tools in combination, traders can create a well-rounded approach that leverages economic insight, technical precision, and disciplined risk management. Whether building long-term macro positions or trading high-frequency reactions, these resources form the foundation of successful trading economics strategies.
🔗 Trading
Trading Strategies Based on Trading Economics
Implementing strategies grounded in trading economics involves several well‑established approaches:
News‑Event Trading
- Pre‑news positioning: Enter just before data release if confident in forecast direction. Risk: surprise and spread widening.
- Post‑news breakout trades: Wait 5–15 minutes after release to catch the directional breakout once volatility settles.
- Fade the move: If initial spike is clearly overdone, fade back toward fair value—requires precise timing.
Surprise‑Based Positioning
- Calculate deviation between actual and forecast. A large positive surprise in GDP or jobs typically pushes currency/markets in corresponding direction.
- Tables or heat‑maps help compare surprise magnitude across releases.
Macro Trend Alignment
- Use rolling cycles—e.g. multiple inflation prints, employment trends—to form directional bias.
- Example: Persistent inflation above target → expect central bank tightening → long financials, short gold or bonds.
Sector Rotation Strategies
- Combine economic data with sectoral responses:
- Higher rates → banks outperform.
- Weak jobs/inflation → growth sectors rally (e.g. tech, consumer discretionary).
- Weak GDP → defensive stocks and bonds.
Carry and Yield Differentials
In forex, interest rate differentials drive carry trades. Using central bank rate signals and inflation trends, traders take positions based on yield advantages.
Calendar-Based Overlays
Some traders overlay seasonal or calendar effects on economic releases. Example: Pre‑announcement positioning ahead of recurring Fed meetings or quarterly earnings tied to macro reports.
Hybrid Technical + Fundamental
Use economic data to set bias/structure, but technical indicators (e.g. moving averages, RSI) for entry and exit trigger confirmation — as described in broader strategy frameworks.
Example Strategy Table:
Strategy Type | Trigger Event | Action | Exit Signal |
Breakout After NFP | Non‑farm payrolls | Enter long/short based on surprise | Exit when momentum fades or hit stop targets |
Inflation Surprise Fade | CPI release | Fade initial spike if overshoot detected | Exit at mean reversion or technical level |
Sector Switch | Rate decision surprise | Rotate into banks or defensive stocks | Exit after rate trend confirmed or reverses |
Practice and backtesting are essential, particularly to avoid overfitting to historical patterns. As with any strategy, psychology and discipline are critical.
Risk Warning:
The information provided in this article is for educational and informational purposes only and does not constitute financial or investment advice. You should carefully consider your financial situation, investment objectives, and risk tolerance before engaging in any trading activity.
🔗 Common
Common Pitfalls in Interpreting Economic Data
Traders often fall prey to misreading or misusing economic data. Awareness of pitfalls is critical to mitigating risk.
Ignoring Forecast vs Actual Surprise
Failing to compare actual with consensus forecast can lead to misinterpreting the news. It’s not the headline number, but its deviation that moves markets most.
Focusing on Only One Indicator
Treating a single release in isolation is misleading—e.g. strong GDP doesn’t override weak employment or inflation surprises that alter central bank bias.

Assuming Immediate or Linear Reaction
Markets may price surprise instantly or over several trading sessions. Reaction is rarely linear and can reverse quickly on second thoughts or follow‑through commentary.
Data Revision Risk
Initial releases (e.g. preliminary GDP) are often revised weeks or months later—leading to retrospective reinterpretation. Basing decisions on unconfirmed data is risky.
Misreading Correlation as Causation
High correlation between two variables doesn’t prove one causes the other. e.g. rising inflation and rising bond yields may correlate, but third‑party drivers may be at play.
Overfitting Backtest Patterns
Designing a strategy based solely on past surprises can lead to curve‑fitting—overly optimized in backtests but ineffective live.
Ignoring Context & Global Factors
Releases must be viewed in geopolitical or policy context—for example, trade tensions, fiscal policy, or central bank communications can introduce volatility not explained by numbers alone.
🔗 Advantages
Advantages of Trading Economics
Trading economics offers traders a richer, data‑driven foundation for decision making.
Systematic Insight
Instead of reacting to chart patterns, traders anchor decisions on objective economic fundamentals—creating structured, fact‑based trades.
Volatility Timing
Economic releases often trigger spikes in volatility. Traders can align positions with event timing—capturing breakouts or fading reversals.
Macro Narrative Building
Understanding multiple indicators (inflation, employment, consumer, business sentiment) helps forecast central bank regimes and economic cycles.
Correlation Management
By tracking how assets correlate with data, traders can diversify or hedge across currencies, equities, bonds, commodities based on expected macro direction.
Carry & Yield Strategies
Interest rate spreads, inflation expectations, and central bank trajectory offer mathematical logic for carry trades, bond yield positioning, or FX exposure.
Scalability & Automation
Indicators are codified—easy to input into algorithmic systems or Expert Advisors on platforms such as MT4/MT5.
🔗 Disadvantages
Disadvantages of Trading Economics
The approach isn’t without limitations or risks.
Data Noise & Uncertainty
Forecast errors, revisions, or ambiguous surprises can result in false signals or whipsaw moves.
Time Lag Costs
Economic indicators often lag the real economy—by the time a signal is visible, price may have moved too far or reversed.
Emotional & Execution Risk
High‑impact releases produce volatile spreads and slippage; improper risk controls can lead to heavy losses.
Overemphasis Risk
Excessive focus on macro moves may ignore technical and sentiment context—leading to mis-timed or mismatched entries.
Diminishing Edge
Once the consensus is shared widely, many participants anticipate and front-run common trades, reducing alpha for retail traders.
Structural Change
Regime shifts, policy changes, or global events can break historical correlations abruptly—past patterns may fail suddenly.
🔗 FAQ
FAQ
Q: What time zones are economic calendar events based on?
A: Most platforms display local time plus UTC/GMT. Always align the calendar to your trading platform's timezone to avoid misaligned orders or news risk.
Q: How reliable are consensus forecasts?
A: These are aggregated from multiple analysts. They offer a baseline expectation—surprise is measured relative to consensus. Forecasts themselves are often revised ahead of releases.
Q: Should I trade based on preliminary data or wait for final revisions?
A: That depends on your time horizon and risk tolerance. Preliminary data can trigger sharp moves, but is riskier; final/revised data offers clarity but often arrives after markets have moved.
Q: Can I combine trading economics with technical analysis?
A: Absolutely. Many traders use economic data to form bias and technical indicators (trend lines, RSI, MA) for entry/exit decisions. This hybrid approach balances fundamentals with timing discipline.
Q: Are certain asset classes better for trading economics?
A: Yes. Forex, stock indices, government bond futures, and commodities often respond swiftly to data releases, enabling event-based strategies with liquid execution.
Q: What’s the best way to handle false breakouts?
A: Use stop-losses, wait for confirmation periods, consider fading ultra-volatility, or use scaled entries/exits. Risk management is vital to prevent large adverse moves.
Q: How can I avoid relying on stale relationships?
A: Regularly recalibrate strategy logic—monitor rolls of correlation matrices, test on out-of-sample data, and watch for macro regime changes that alter behavior.
Q: Do central bank speeches count as economic events?
A: Yes. Speeches, minutes, and forward guidance are often market-moving—sometimes more so than headline data. Integrate them as high-impact events in your calendar.
Kembali Kembali
