Candlestick patterns are visual price formations that help traders identify potential trend reversals, continuations, and market indecision. The most important patterns are Hammer, Bullish Engulfing, Morning Star, Shooting Star, Bearish Engulfing, Evening Star, and Doji.
Candlestick patterns are chart formations that show the battle between buyers and sellers over a chosen time period. Each candle displays the open, high, low, and close, which makes it possible to read momentum, rejection, and possible turning points. Traders use these patterns to identify reversals, continuations, and moments of indecision across forex, stocks, indices, commodities, and cryptocurrencies. The patterns are not magic signals, but they become useful when combined with trend analysis, support and resistance, and confirmation from volume or indicators.
What Are Candlestick Patterns?
Candlestick patterns are repeated price formations that reflect market psychology. A single candle can show hesitation, strength, or rejection, while a group of candles can reveal a stronger shift in direction. Traders use them because price often leaves clues before a bigger move happens.
- A bullish pattern suggests buyers may be gaining control.
- A bearish pattern suggests sellers may be gaining control.
- A neutral pattern suggests the market is undecided.
Candlestick analysis belongs to price action trading, which focuses on what price is doing rather than relying only on indicators.
Why Traders Use Them
Candlestick patterns help traders make faster decisions by turning raw price data into a readable structure. They are especially useful when a market is approaching a key level, such as support, resistance, a trendline, or a moving average. They also help traders wait for confirmation instead of entering blindly.
Traders use them to:
- Spot potential reversals.
- Confirm trend continuation.
- Time entries and exits.
- Understand short-term sentiment.
- Filter false breakouts.
The best candlestick setups usually appear when pattern, location, and confirmation align.
Bullish Patterns
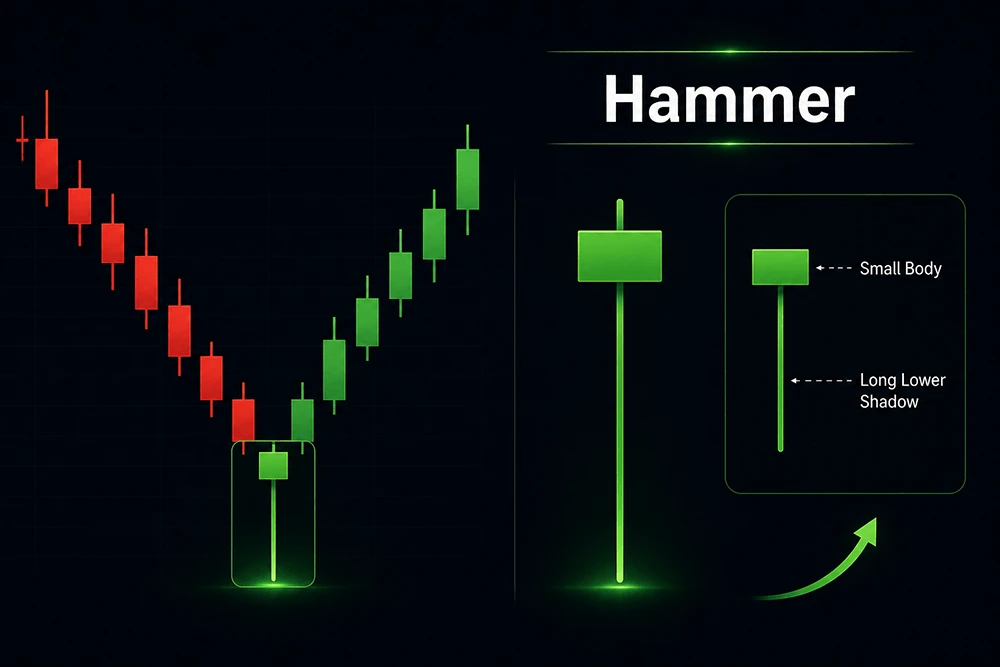
Hammer
A hammer forms after a decline and has a small body with a long lower wick. It shows that sellers pushed price down, but buyers recovered most of the move before the candle closed. This often suggests a possible bullish reversal.
A hammer is stronger when it appears near support or after a clear downtrend. On its own, it is a warning sign, not a guarantee.
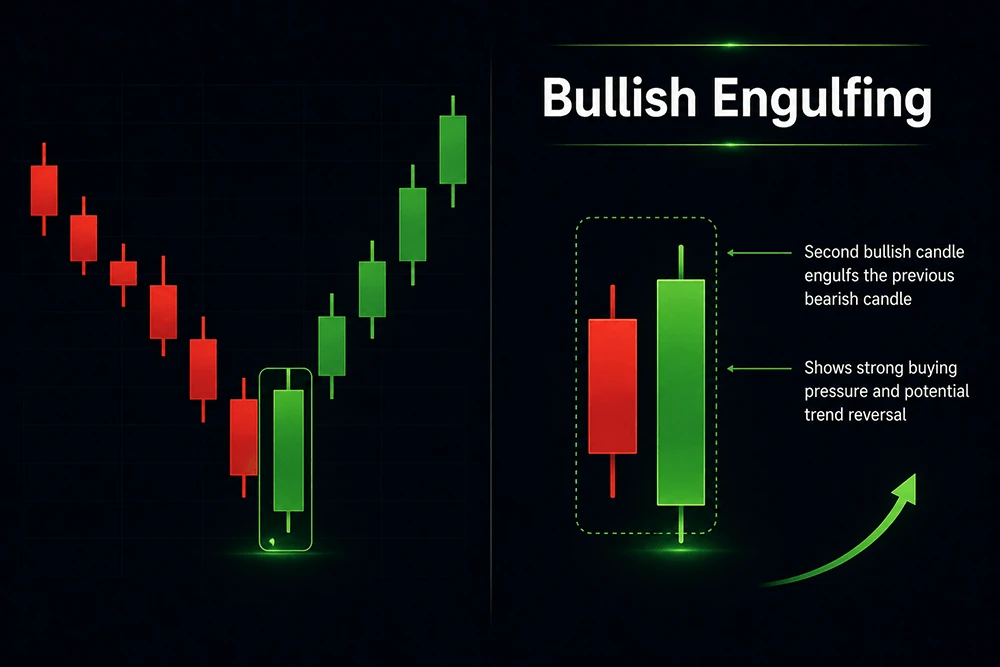
Bullish Engulfing
A bullish engulfing pattern appears when a strong bullish candle completely covers the body of the previous bearish candle. It shows that buyers have taken control after a period of selling pressure. This is one of the most widely watched reversal patterns.
It is more reliable when the second candle closes well above the prior candle’s open. That shows meaningful momentum, not just a small bounce.
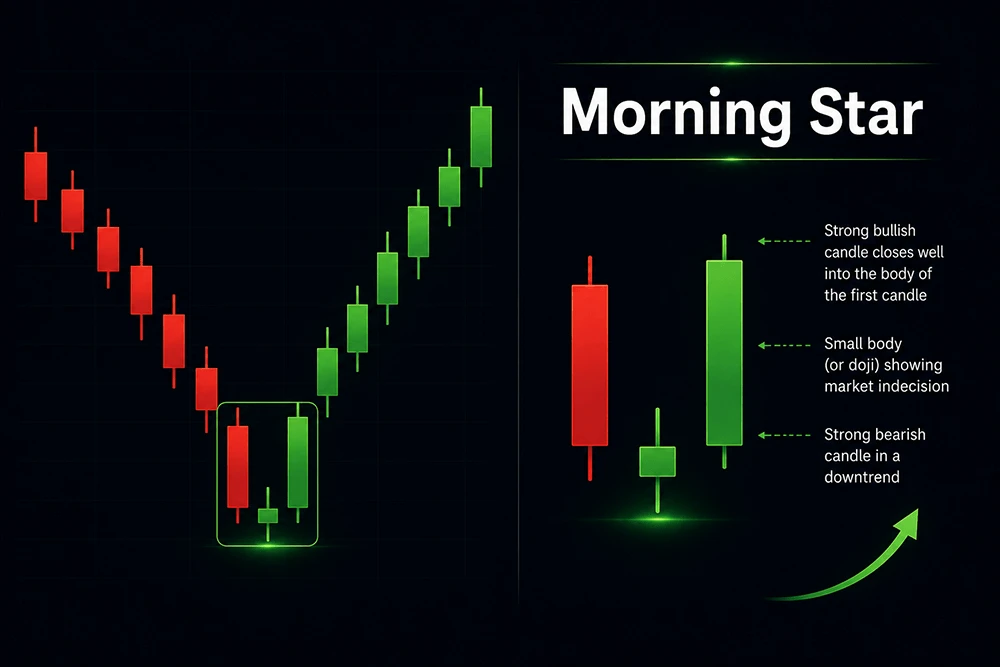
Morning Star
A morning star is a three-candle bullish reversal pattern. The first candle is bearish, the second shows indecision, and the third is a strong bullish candle. Together, they show that selling pressure is fading and buyers are stepping in.
This pattern is especially useful after extended downside movement. The third candle is the key confirmation candle.
Bearish Patterns
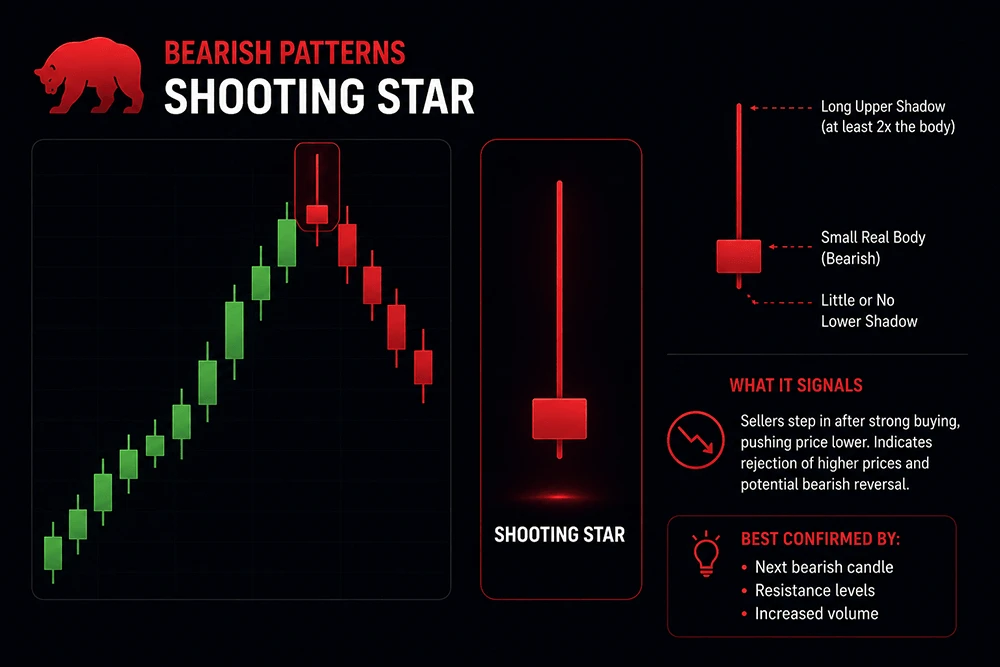
Shooting Star
A shooting star forms after an advance and has a small body with a long upper wick. It shows that buyers pushed price higher, but sellers forced it back down before the close. This often signals a possible bearish reversal.
It becomes more meaningful when it appears near resistance or after a strong rally. Context matters more than the candle shape alone.
Bearish Engulfing
A bearish engulfing pattern appears when a strong bearish candle fully covers the body of the previous bullish candle. It shows that sellers have overwhelmed buyers and may be taking control. Traders often watch it as a sign of a short-term top.
This pattern is stronger when it appears after a clear uptrend and closes near the candle low. That suggests persistent selling pressure.
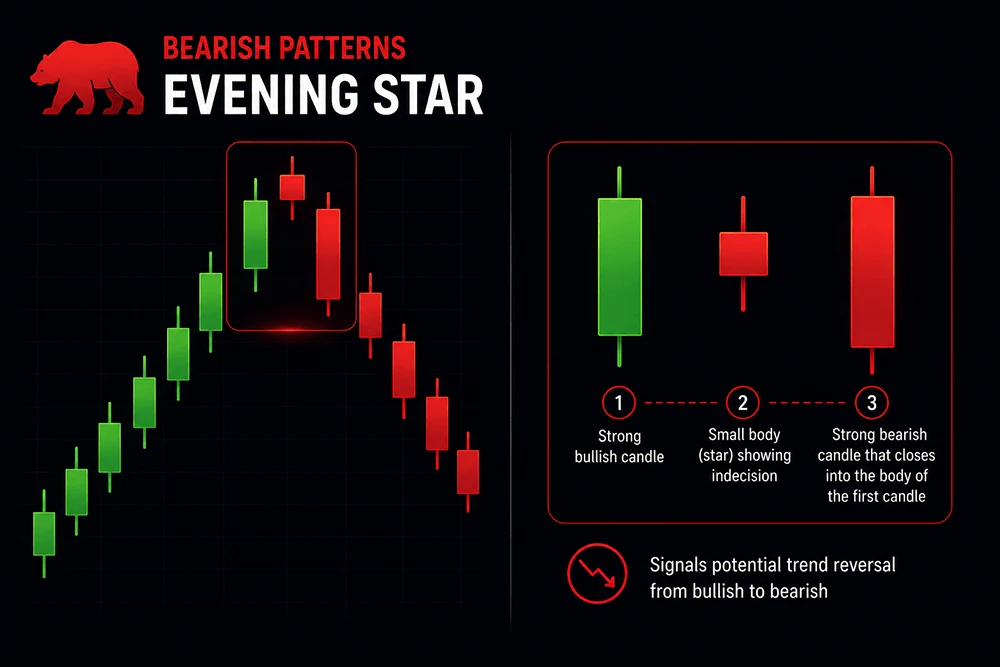
Evening Star
An evening star is the bearish version of the morning star. It has three candles: a bullish candle, a small indecision candle, and then a strong bearish candle. It often appears after an advance and can signal that momentum is shifting downward.
The pattern works best when the third candle closes deep into the first candle’s body. That confirms the reversal signal.
Neutral Patterns
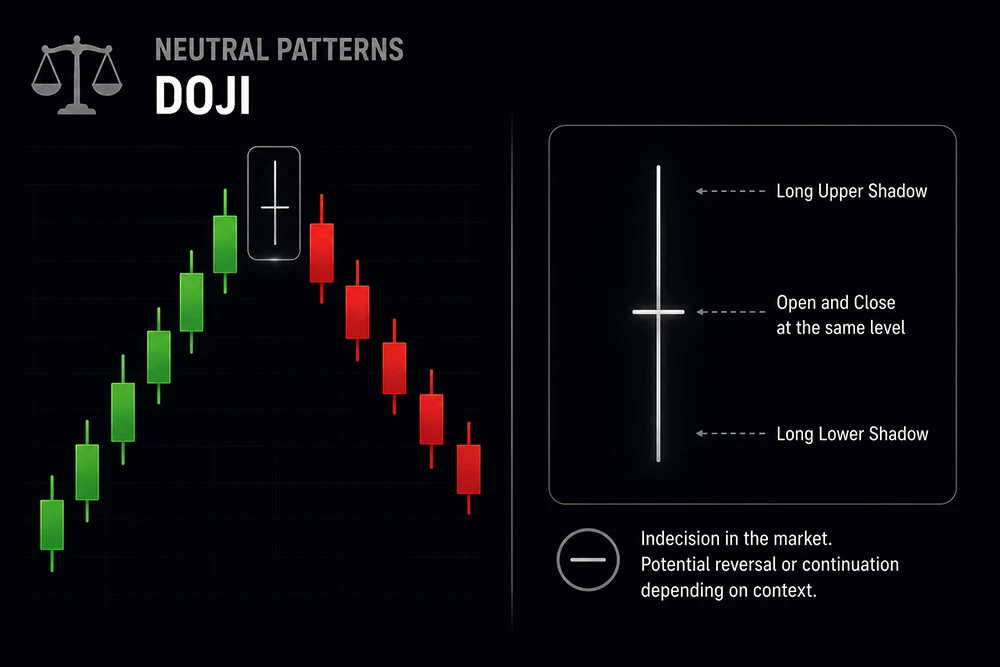
Doji
A doji forms when the open and close are nearly equal. It shows indecision and a temporary balance between buyers and sellers. A doji can appear before a reversal, but it can also appear during consolidation without causing a major move.
The candle becomes more meaningful when it appears after a strong trend or at an important chart level. The next candle usually provides the real clue.
How To Use Them
Candlestick patterns work best as confirmation tools, not as standalone signals. The stronger the surrounding context, the better the pattern tends to perform. A pattern near support or resistance matters more than the same pattern in the middle of a random range.
Use this simple process:
- Identify the trend.
- Mark support and resistance.
- Look for a candlestick pattern at a meaningful level.
- Wait for confirmation from the next candle.
- Check volume or momentum indicators.
- Manage risk with a stop loss.
Pattern | Signal | Type | Typical Location |
Hammer | Bullish reversal | Bullish | End of downtrend |
Bullish Engulfing | Bullish reversal | Bullish | End of downtrend |
Morning Star | Bullish reversal | Bullish | End of downtrend |
Shooting Star | Bearish reversal | Bearish | End of uptrend |
Bearish Engulfing | Bearish reversal | Bearish | End of uptrend |
Evening Star | Bearish reversal | Bearish | End of uptrend |
Doji | Indecision | Neutral | Any trend |
Example: A long upper wick after an uptrend, especially near resistance, often signals a shooting star or bearish pin bar. This candle shows that buyers pushed price higher, but sellers stepped in and forced it back down before the close, which can hint at bearish rejection and a possible reversal.
Common Mistakes
Many traders lose money because they treat candlestick patterns like automatic signals. That usually leads to poor entries and unnecessary losses. The pattern matters, but the location and market context matter more.
Avoid these mistakes:
- Trading every pattern you see.
- Ignoring the overall trend.
- Using patterns without confirmation.
- Buying a bullish pattern into major resistance.
- Selling a bearish pattern into major support.
A pattern is a clue, not a command.
Which Patterns Matter Most
For most traders, the most practical patterns are the hammer, shooting star, bullish engulfing, bearish engulfing, morning star, evening star, and doji. These are easy to recognize and often appear at important turning points. They are also useful across multiple markets because they reflect the same buyer-seller behavior.
If you are a beginner, start with:
- Doji.
- Hammer.
- Shooting star.
- Bullish engulfing.
- Bearish engulfing.
These patterns give you a solid base for reading price action.
How Reliable Are They
Candlestick patterns are moderately reliable when used correctly, but they are not perfect. Their accuracy depends on trend context, market volatility, timeframe, and confirmation. A pattern that looks strong on a 1-minute chart may mean very little compared with the same pattern on a daily chart.
The best results usually come from combining:
- Trend direction.
- Support and resistance.
- Volume.
- RSI or MACD.
- Clear risk management.
This is why professional traders treat candlesticks as part of a broader decision process.
FAQ
What is the most reliable candlestick pattern?
Bullish and bearish engulfing patterns are among the most useful because they show a clear shift in control between buyers and sellers.
Do candlestick patterns work in all markets?
Yes, they can be used in forex, stocks, indices, commodities, and crypto because they reflect universal market psychology.
Can beginners learn candlestick patterns easily?
Yes. The basic patterns are simple to recognize, especially when traders focus on a few core formations first.
Should candlestick patterns be used alone?
No. They work best when combined with trend analysis, support and resistance, and confirmation indicators.
Final View
Candlestick patterns are valuable because they help traders read price behavior quickly and clearly. The patterns that matter most are the ones that appear in the right place, at the right time, and with confirmation. If you focus on a few core setups and avoid trading every candle you see, candlestick analysis becomes a practical edge rather than a guessing game.
Meet the Author
Vanessa Polson is a marketing manager at NordFX with over twelve years of experience in online marketing within the financial services industry. She has developed and executed data-driven campaigns across search, social, and display channels in in-house environments. Her work focuses on translating complex financial products and trading tools into clear, practical educational content, giving her a broad and well-rounded view of the global trading landscape.
Connect with Vanessa on LinkedIn.
திரும்பிச் செல்லவும் திரும்பிச் செல்லவும்
