EUR/USD: Market Anticipates Federal Reserve Rate Cut
● We published our global forecast for EUR/USD for the upcoming year in the last week of 2023. Now, moving from long-term projections, we return to our traditional weekly reviews, which have been conducted by the NordFX analytical group for over a decade.
The main event of the past week was undoubtedly the U.S. inflation data. The figures released on Thursday, January 11, showed that the Consumer Price Index (CPI) rose by 3.4% year-on-year, compared to a consensus forecast of 3.2% and a previous value of 3.1%. On a monthly basis, consumer inflation also increased, registering 0.3% against a forecast of 0.2% and a previous figure of 0.1%. On the other hand, the core CPI, which excludes volatile food and oil prices, decreased to 3.9% from a previous value of 4.0% (year-on-year).
● Recall that with his dovish remarks at the December press conference, Federal Reserve Chairman Jerome Powell created the impression that he is no longer the staunch inflation fighter he appeared to be earlier. This suggests that the U.S. monetary authorities will now respond more flexibly to changes in this indicator. Consequently, the mixed CPI data further convinced market participants that the Fed will begin to ease its policy by the end of Q1 2024. According to CME Fedwatch, the likelihood of a 25 basis point rate cut in March increased to 68% from 61% prior to the release of the statistics. Meanwhile, strategists at the largest banking group of the Netherlands, ING, expect a significant weakening of the dollar towards the end of Q2: that's when they anticipate EUR/USD will start its rally to 1.1500. Until then, in their view, the currency market will remain quite unstable.
● Regarding the Eurozone, statistics released on Monday, January 8, indicated that the situation in the consumer market is bad, but not as dire as expected. Retail sales showed a decline of -1.1% year-on-year. This figure, although higher than the previous value of -0.8%, was significantly below the forecast of -1.5%.
In this context, the statement by European Central Bank (ECB) board member Isabel Schnabel appeared rather hawkish. She opined that economic sentiment indicators in the Eurozone have likely reached their nadir, while the labour market remains stable. Schnabel also did not rule out the possibility of a soft landing for the European economy and a return to the inflation target of 2.0% by the end of 2024. According to her, this is still achievable, but it would require the ECB to maintain a high interest rate. This contrast between the hawkish stance of the pan-European mega-regulator and the dovish comments of its overseas colleagues supported the euro, preventing EUR/USD from falling below 1.0900.
● Data on industrial inflation in the U.S., released at the end of the workweek on Friday, January 12, also showed a decline in this indicator, but it did not have a strong impact on the quotes. The Producer Price Index (PPI) was 1.8% year-on-year (forecast 1.9%, previous value 2.0%), and the monthly PPI, like in November, recorded a decrease of -0.1% (forecast +0.1%).
Following the release of this data, EUR/USD closed the workweek at 1.0950.
Currently, experts' opinions regarding the near future of the pair provide no clear direction, as they are evenly split: 50% voted for a strengthening of the dollar, and 50% sided with the euro. Technical analysis indicators also appear quite neutral. Among trend indicators on D1, the balance of power between red and green is 50% to 50%. Among oscillators, 25% have turned green, another 35% are in a neutral grey, and the remaining 40% are red, with a quarter of them signalling that the pair is oversold. The nearest support for the pair is in the zone of 1.0890-1.0925, followed by 1.0865, 1.0725-1.0740, 1.0620-1.0640, 1.0500-1.0515, 1.0450. Bulls will encounter resistance in the areas of 1.0985-1.1015, 1.1185-1.1140, 1.1230-1.1275, 1.1350, and 1.1475.
● Next week, notable economic events include the release of Consumer Price Index (CPI) data for Germany on Tuesday, January 16, and for the Eurozone on Wednesday, January 17. Additionally, Wednesday will bring statistics on the state of the U.S. retail market. On Thursday, January 18, the usual figures for initial jobless claims in the United States will be released. The same day, we will learn the value of the Philadelphia Federal Reserve's Manufacturing Business Outlook Survey, and on Friday, the University of Michigan's Consumer Sentiment Index will be published. Furthermore, traders should be aware that Monday, January 15, is a public holiday in the U.S. as the country celebrates Martin Luther King Jr. Day.
GBP/USD: Pound Retains Potential for Growth
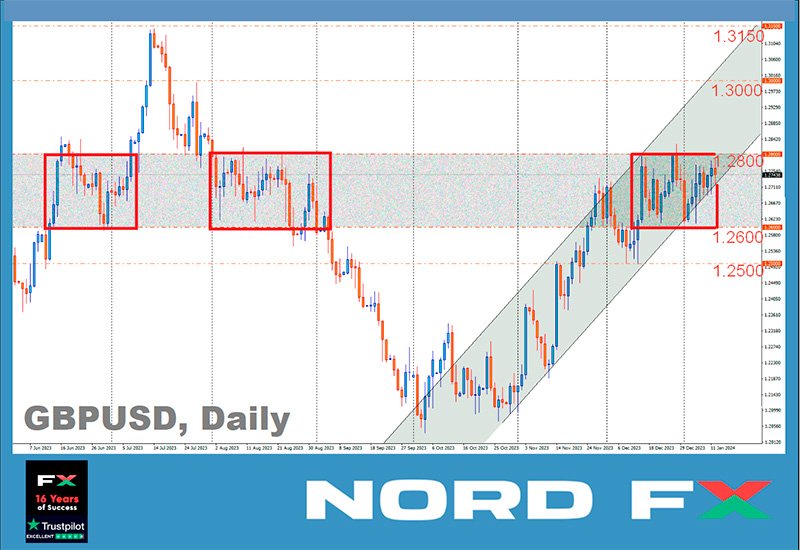
● Before the New Year holidays, GBP/USD reached its highest level since August 2023, touching 1.2827. It then fell by more than 200 points to the lower line of the ascending channel and, bouncing off it, began to rise again. At the time of writing this forecast, it is difficult to confidently say that the pound has returned to a firm upward trend. The dynamics of the last four weeks can be interpreted as a sideways trend. A similar pattern, specifically in the 1.2600-1.2800 zone, was observed in August. Back then, it was merely a temporary respite before the pair's fall continued with renewed vigour. It's possible that we are witnessing a similar scenario now, but with a positive sign instead of a negative one. If this is the case, we could see GBP/USD in the 1.3000-1.3150 zone during the first quarter.
● Last week, the British currency was bolstered by data on inflation in the U.S. and forecasts regarding a dovish pivot by the Federal Reserve. The UK's Office for National Statistics (ONS) also supported the pound, reporting on Friday, January 12, that the country's GDP in November grew by 0.3% month-on-month, against a forecast of 0.2% and a decrease of -0.3% recorded in October. Additionally, the volume of manufacturing output rose by 0.4% month-on-month in November (forecast 0.3%, previous value – a decline of -1.2%). At the same time, the British FTSE 100 index rose by 0.8%, reflecting the market's optimistic mood and its participants' appetite for risk.
● GBP/USD concluded the week at 1.2753. According to economists at Scotiabank, for the pound to maintain its bullish momentum, it needs to confidently overcome resistance in the 1.2800-1.2820 zone. "However," they write, "the absence of a breakthrough in the 1.2800 area may begin to weary [market participants], and the price actions over the last month are still shaping up as potentially bearish."
Despite the pound retaining potential for growth in the medium term, the experts' forecast for the coming days leans towards the dollar. 60% of them voted for a fall in the pair, 25% for its rise, and 15% preferred to remain neutral. In contrast to the specialists, the indicators almost unanimously favour the British currency: among the oscillators on D1, 90% are on the side of the pound (with 10% neutral), and among trend indicators, all 100% are pointing upwards. If the pair moves south, it will encounter support levels and zones at 1.2720, 1.2650, 1.2600-1.2610, 1.2500-1.2515, 1.2450, 1.2330, 1.2210, 1.2070-1.2085. In the event of a rise, it will face resistance at levels 1.2785-1.2820, 1.2940, 1.3000, and 1.3140-1.3150.
● For the upcoming week, notable dates include Tuesday, January 16, when a significant batch of labour market data from the United Kingdom will be released. Consumer Price Index (CPI) data will be published on Wednesday, January 17, and retail sales figures in the UK will be available on Friday, January 19.
USD/JPY: U.S. CPI Outperforms Japan's CPI
● The Bank of Japan (BoJ) is considering lowering its inflation forecast for the 2024 fiscal year to around the mid-2% range in its upcoming quarterly report, set to be published on January 23. This news was reported by the Jiji agency, citing Reuters, on Thursday, January 11. Japan's real wages fell by 3.0%. With a sharp slowdown in wage growth, Tokyo's Consumer Price Index (CPI) was below forecasts, dropping from 2.7% to 2.4%. Interpreting these data, analysts have begun to speculate that the Bank of Japan might delay tightening its ultra-loose monetary policy. Following this logic, traders were advised to open long positions in the USD/JPY pair.
However, after reaching a peak of 146.41 on January 11, the pair reversed and began to decline: the decrease in U.S. inflation turned out to be much more significant for market participants than the decrease in Japan's inflation. The fact that the interest rate on the yen will remain at a negative level of -0.1% is not so crucial. What is more important is that the rate on the dollar could soon drop by 0.25%.
● Mathias Cormann, the Secretary-General of The Organisation for Economic Co-operation and Development (OECD), recently stated that "the Bank of Japan has opportunities to further consider the level of tightening of its monetary policy." However, we have already heard many such vague statements and opinions. In our view, it is much more interesting to present the technical analysis of the current situation performed by economists at the French bank Societe Generale.
"They write that USD/JPY sharply recovered after forming an intermediate low around 140.20 at the end of last month. It has returned to the 200-Day Moving Average (200-DMA) and approached the October low of 146.60-147.40, which acts as an intermediate resistance zone. After an unsuccessful attempt to break through the 50-day moving average at the level of 146.41 on Thursday, January 11, the pair is retreating, indicating the start of an initial pullback. "It will be interesting to see if the pair can hold the 200-DMA around 143.40. Failure would mean the risk of another decline towards 140.20-139.60. A breakthrough above 146.60-147.40 is necessary to confirm the continuation of the rebound [upwards]," they believe at Societe Generale.
● USD/JPY ended last week at 144.90. (Interestingly, the current dynamics fully align with the wave analysis we discussed in our previous review). In the near term, 40% of experts anticipate further strengthening of the yen, another 40% are in favour of the dollar, and 20% hold a neutral position. Regarding the trend indicators on D1, 60% are pointing north, while the remaining 40% are looking south. Among the oscillators, 70% are coloured green (with 15% in the overbought zone), 15% are red, and the remaining 15% are neutral grey. The nearest support level is in the zone of 143.75-144.05, followed by 142.20, 141.50, 140.25-140.60, 138.75-139.05, 137.25-137.50, and 136.00. Resistance levels are located at 145.30, 146.00, 146.90, 147.50, 148.40, 149.80-150.00, 150.80, and 151.70-151.90.
● No significant events concerning the Japanese economy are expected in the coming week
CRYPTOCURRENCIES: Day X Has Arrived. What's Next?
● What many have long talked about and dreamed of has finally come to pass. As expected, on January 10, the U.S. Securities and Exchange Commission (SEC) approved a batch of 11 applications from investment companies to launch spot exchange-traded funds (ETFs) based on Bitcoin. As a result, ETFs from Grayscale, as well as from Bitwise and Hashdex, were admitted to the NYSE Arca stock exchange. BlackRock and Valkyrie funds are being launched on Nasdaq. CBOE will host ETFs from VanEck, Wisdom Tree, Fidelity, Franklin Templeton, as well as joint funds from ARK Invest/21 Shares and Invesco/Galaxy.
Contrary to expectations, immediately after the approval, the BTC/USD pair's rate rose only to $47,652 instead of a jubilant surge. The reason for such a tepid reaction is that the market had already priced in this event. Moreover, the day before, hackers breached the SEC's account on social network X (formerly Twitter) and published a fake tweet about the approval of the long-awaited BTC-ETFs. The market then reacted to this false statement with a rise in the main cryptocurrency to the $48,000 mark. After the refutation, the price fell back down, and on January 10, it merely repeated what had happened the day before.
● It's important to note that the SEC was not particularly pleased with its decision to approve the applications. The first application for a spot ETF was filed back in 2013 by the Winklevoss brothers (Cameron & Tyler Winklevoss) and was rejected in 2017. Approximately six years have passed since then, but the regulator's aversion to cryptocurrencies remained, and the current approval was granted somewhat reluctantly and under pressure. According to a press release by the agency's chair Gary Gensler, the Commission's decision was based on a ruling by the appellate court in Grayscale's lawsuit regarding the transformation of a trust fund into a spot ETF. The court ruled in favour of Grayscale, stating that the SEC “failed to adequately justify its reasons for refusal.” After this, delaying the approval of similar products was no longer sensible.
However, on January 10, Gensler did not hold back in his negative assessment. "Despite the approval of spot BTC-ETFs," he noted in the press release, "we do not endorse bitcoin. Investors should consider the numerous risks associated with Bitcoin and products whose value is tied to the cryptocurrency. Bitcoin is primarily a speculative, volatile asset that is also used for illegal activities, including ransomware, money laundering, evasion of sanctions, and financing of terrorism. Today, we approved the listing and trading of certain ETP spot bitcoin shares, but we did not approve Bitcoin," concluded the SEC head, making it clear that the battle with digital assets is far from over.
● Discussing the short-term perspective, many analysts did not anticipate a significant rally, pointing to $48,500 as a key resistance level. They proved correct: after BTC/USD breached this level on September 11, a "sell the news" phenomenon ensued – a mass closure of buy-orders and profit-taking. Consequently, the price sharply retraced. According to Coinglass, the total sum of liquidations for all cryptocurrency positions was approximately $209 million.
Regarding the long-term impact of the launch of spot bitcoin ETFs, time is needed for a full assessment. About a week is necessary for the funds to commence operations on exchanges, with investment volume data expected around mid-February. If we compare with ETFs for other products, approximately $1.2 trillion has been invested in them over the past two years. Seven years after the 2004 launch of physical gold ETFs, the price of this metal quadrupled, and now over $100 billion is held in gold ETFs.
Concerning digital gold, analysts at Standard Chartered bank consider the approval of bitcoin ETFs a pivotal moment for the asset's acceptance. "Bitcoin will likely see growth akin to gold-linked exchange-traded products," they write. "But this is expected to materialize over a shorter period: not in seven to eight years, as was the case with gold, but within one to two years, considering the swift evolution of the crypto market." The bank forecasts bitcoin's price potentially reaching $200,000 by the end of 2025. Standard Chartered estimates that by the end of 2024, exchange-traded funds could hold between 437,000 BTC and 1.32 million BTC, equating to a market inflow of $50-100 billion, creating a significant price impulse for the primary cryptocurrency.
Venture investor Chamath Palihapitiya also expresses a comparable sentiment. He believes that 2024 could emerge as a landmark year for bitcoin. The billionaire highlighted that the approval of numerous spot exchange-traded ETFs is likely to "revolutionize BTC," potentially leading to its widespread adoption. Palihapitiya remarked that in such a scenario, by the end of 2024, bitcoin could become a staple in traditional financial parlance.
● According to CoinDesk data, the 40-day correlation between digital gold and the Nasdaq 100 technology index has dropped to zero. Over the past four years, this price correlation has been positive, varying from moderate (0.15) to strong (0.8), reaching its peak during the bear market of 2022. Now, bitcoin has completely "decoupled" from Nasdaq. This correlation reset may signify bitcoin's potential as an attractive diversification tool for investment portfolios, thereby enhancing its value.
Macro-strategist Henrik Zeberg also anticipates a phenomenal bull market in 2024. He expects the dynamics of digital assets this year, driven by the entry of new players, to be "parabolic." "[Bitcoin] is going to be absolutely explosive – it will shoot up vertically. I think we will reach at least $115,000. That's my most conservative forecast. The $150,000 level is also feasible, and I see the potential for $250,000," the economist notes.
Zeberg added that the first four months of 2024 could be "incredibly impressive" for the crypto market, thanks to institutional and traditional investors entering after the approval of spot bitcoin ETFs. Those who missed out on the first or second bull cycle will now say, "Oh, I missed the first two times, but I'll be in this one." However, he believes that traditional markets are facing "the worst crash since 1929," when the Great Depression began in the U.S.
Renowned analyst known as PlanB believes that the price of bitcoin could soon reach between $100,000 and 1 million. He explains that he doesn't expect a BTC price drop, as its adoption level is currently only 2-3%. According to the logistic S-curve of organizational development and Metcalfe's law, a decrease in asset profitability should not be expected while the adoption level is below 50%. Therefore, the analyst opines, "the main cryptocurrency is set for exponential growth for a couple more years."
● Indeed, alongside the optimists, there are many who forecast a downward trend. We discussed some of these views two weeks ago in a special review titled "Forecast 2024: Bitcoin Yesterday, Tomorrow, and the Day After." Currently, it's worth noting the recent statement from TV host and founder of hedge fund Cramer & Co., Jim Cramer. He asserted that bitcoin has reached its peak and further growth should not be expected. This statement was made as bitcoin surpassed the $47,000 mark. Observing bitcoin's performance on January 11-12, it raises the question: "Could Jim Cramer be right?"
As of the evening of January 12, when this review was written, BTC/USD is experiencing a significant drop, trading around $43,000. The total market capitalization of the crypto market is at $1.70 trillion, up from $1.67 trillion a week ago. The Bitcoin Fear & Greed Index over the week has decreased from 72 to 71 points and remains in the Greed zone.
● Contrary to bitcoin's performance, the leading altcoin exhibited a much more impressive growth last week. Starting from a level of $2,334 on January 10, ETH/USD reached a weekly high of $2,711 on January 12, showcasing a 16% increase. Interestingly, this surge occurred after the SEC Chairman's statement emphasizing that the regulator's positive decision exclusively pertained to exchange-traded products based on bitcoin. Gary Gensler clarified that this decision "in no way signals readiness to approve listing standards for crypto assets that are securities." It's worth noting that the regulator still regards only bitcoin as a commodity, while considering "the overwhelming majority of crypto assets as investment contracts (i.e., securities)." Therefore, the hope for the imminent arrival of spot ETFs with Ethereum and other altcoins is unfounded.
Yet, against this rather grim backdrop, ETH suddenly soared. The market's reaction is indeed inscrutable. However, towards the end of Friday, January 12, Ethereum followed bitcoin in a downturn, welcoming Saturday in the $2,500 zone.
NordFX Analytical Group
Notice: These materials are not investment recommendations or guidelines for working in financial markets and are intended for informational purposes only. Trading in financial markets is risky and can result in a complete loss of deposited funds.
Go Back Go Back
