EUR/USD: Dollar Dips but Promises a Rebound
● Last week saw a scarcity of significant macroeconomic data. In anticipation of new drivers, market participants analysed the state of the US labour market and statements from Federal Reserve officials.
Data released on February 2 revealed that the number of new jobs in the US non-farm sector (Non-Farm Payrolls) increased by 353,000 in January, against the expected 180,000. This figure followed a December increase of 333,000. Unemployment remained stable at 3.7%, although experts had forecast a rise to 3.8%. Meanwhile, wage inflation grew to 4.5% on an annual basis, significantly exceeding market expectations of 4.1%. The report, issued on Thursday, February 8, was also robust, showing that the number of US citizens applying for unemployment benefits was 218K, down from 227K previously.
Thus, Federal Reserve Chair Jerome Powell's concerns proved unfounded. Recall that he recently suggested that if the labour market were to cool sharply, easing of monetary policy could occur quite rapidly. However, no cooling has occurred, so the FOMC members may not rush to a dovish pivot until they see convincing evidence of inflation dropping below the 2.0% target.
Subsequent comments from Fed representatives confirmed the low likelihood of an easing of national monetary policy in the near term. For instance, Susan Collins, President of the Federal Reserve Bank of Boston, stated that due to a strong labour market and economic growth, a rate cut is currently not advisable. Her colleague from the Federal Reserve Bank of Richmond, Thomas Barkin, expressed serious doubts about the sustainability of the inflation reduction pace, as price growth continues in the services and rental sectors. As the figures above indicate, wage inflation is also rising.
Against this backdrop of the regulator's representatives' hawkish stance, the probability of a rate cut in March has decreased, and according to the FedWatch Tool, it currently stands at only 15.5%, with May at 54.1%. In such conditions, bulls on the Dollar Index (DXY) feel significantly more confident than bears.
● Regarding the euro, the common European currency has been significantly impacted by recent dovish statements from European Central Bank (ECB) officials. Weak statistics from the Eurozone also support the case for an earlier start to monetary policy easing. A comparison of macroeconomic indicators between the Old and New Worlds suffices to illustrate this. Unemployment in the Eurozone stands at 6.4% compared to 3.7% in the US. European GDP in Q4 barely moved from a recessionary level of -0.1% to 0% (in contrast to the US, which saw a +3.3% increase). The service sector activity index dropped from 48.8 to 48.4 points, while the composite indicator, which includes both services and manufacturing, is at 47.9 points. Hence, both these indicators remain in the stagnation zone (below 50.0). In Germany, exports of goods decreased by 4.6% in December, and imports by 6.7%.
On the other hand, the Consumer Price Index (CPI), a crucial inflation indicator, showed a slight increase in consumer prices in Germany from 0.1% to 0.2% month-on-month, offering the euro some support by giving investors hope that the ECB may not be the first to cut rates. As a result, EUR/USD ended the week at 1.0785.
● A number of experts believe that the dollar's weakening last week was a corrective pullback, and the fundamental backdrop continues to favor the American currency. As of the writing of this review, on the evening of Friday, February 9, 70% of experts voted for a strengthening of the dollar in the near future and a further decline of the pair. 15% sided with the euro, and an equal percentage adopted a neutral position. Oscillators on D1 share a similar view: 65% are coloured red, indicating a bearish outlook, 10% green, showing a bullish outlook, and 25% in neutral grey. Among trend indicators, the distribution of forces between red (bearish) and green (bullish) stands at 65% to 35%. The nearest support for the pair is located in the zone of 1.0725-1.0740, followed by 1.0680, 1.0620, 1.0495-1.0515, and 1.0450. Bulls will encounter resistance at levels 1.0800-1.0820, 1.0865, 1.0925, 1.0985-1.1015, 1.1110-1.1140, and 1.1230-1.1275.
● The upcoming week's noteworthy events include the publication of the US Consumer Price Index (CPI) data on Tuesday, February 13. Market participants will analyse the latest Eurozone GDP data on February 14, the same day Valentine's Day is celebrated. American statistics on manufacturing activity, unemployment, and retail sales volume will be highlighted on Thursday, February 15. The week will conclude with the release of the US Producer Price Index (PPI) for January on Friday.
GBP/USD: Factors Supporting and Weighing on the Pound
● On Friday, February 2, strong data from the US labour market strengthened the dollar and pushed GBP/USD from the upper boundary of the sideways channel at 1.2600-1.2800 to the lower end. The decline continued over the past week, with the pair finding a local bottom at 1.2518 on February 5. It is to the credit of the British currency that it managed to recover its losses and returned to the 1.2600 zone, which shifted from support to resistance.
Analysts believe that the British currency continues to be supported by expectations that the Bank of England (BoE) may be among the last to cut rates this year. It's worth noting that on February 1, the BoE held its meeting and kept the key rate at the previous level of 5.25%. However, the pound received support because two members of the BoE's Monetary Policy Committee continued to vote for a rate hike of 25 basis points (bps). The following day, Catherine Mann explained that she voted for a rate increase because she is not confident that the decline in core inflation will continue in the near term. Another Committee member, Jonathan Haskel, acknowledged that inflationary pressures might be easing but noted that he would need additional evidence of this process before changing his stance on rate hike prospects.
Furthermore, GBP/USD is significantly influenced by market participants' risk appetite, which has been increasing, as evidenced by the quotations of stock indices such as the S&P 500, Dow Jones, and Nasdaq. Consequently, hawkish remarks from Bank of England representatives and improved sentiment regarding risk have helped the pair offset its losses.
● Working against the British currency is the fact that inflationary pressures are indeed starting to ease. According to the KPMG and the Recruitment & Employment Confederation's UK Report on Jobs, the wage inflation index decreased from 56.5 points to 55.8 points in January, indicating that wage growth in the country was at its slowest pace since March 2021. Thus, signs of cooling inflation serve as an argument for the Bank of England to begin cutting interest rates. At the regulator's last meeting, as mentioned, two members of the Committee voted for an increase in borrowing costs, eight for keeping the rate unchanged, and only one member voted for a reduction. However, if at the next meeting on March 21, the doves gain not just one but two or three votes, this could trigger active selling of the GBP/USD pair.
● The pair concluded the past five-day period at the mark of 1.2630. Regarding the median forecast of analysts for the coming days, 50% voted for the pair's decline, 15% for its rise, and the remaining 35% abstained from commenting. Among the oscillators on D1, 50% indicate a downward direction, the remaining 50% look eastward, with none showing a preference for moving north. The situation with trend indicators is different, where a slight majority favors the British currency – 60% pointing north and the remaining 40% south. Should the pair move southward, it will encounter support levels and zones at 1.2595, 1.2570, 1.2495-1.2515, 1.2450, 1.2330, 1.2210, 1.2070-1.2085. In case of an upward movement, resistance will be met at levels 1.2695-1.2725, 1.2785-1.2820, 1.2940, 1.3000, and 1.3140-1.3150.
● Regarding the UK economy, the upcoming week's calendar highlights include a speech by Bank of England Governor Andrew Bailey on Monday, February 12. A significant amount of statistics from the British labour market will be released on Tuesday, February 14. On Wednesday, February 15, the Consumer Price Index (CPI) values will be announced, followed by the country's GDP indicators on February 16. The week's stream of statistics will conclude on Friday, February 16, with the publication of data on retail sales in the UK.
USD/JPY: The Pair's Flight to the Moon Continues
● Thanks to the hawkish rhetoric from Federal Reserve representatives, USD/JPY continued to rise last week, coming close to the psychological resistance level of 150.00. It likely would have breached this level, but market participants are exercising caution ahead of the January Consumer Price Index (CPI) data release in the US, which is scheduled for February 13.
● The yen continues to be under pressure due to the Bank of Japan's (BoJ) persistent dovish stance. Investors observe that the regulator still has no intention of raising interest rates. On Thursday, February 8, BoJ Deputy Governor Shinichi Uchida stated that "the future course of rates depends on economic and price developments" and that monetary policy conditions in the Japanese economy are on a deeply negative trajectory, with no expectations of aggressive inflation. The following day, BoJ Governor Kazuo Ueda traditionally spoke, stating that "the chances of maintaining accommodative conditions are high even if negative rates are abandoned."
From this, the market concluded that if any changes are to be made to the central bank's monetary policy, they will occur very slowly and it's uncertain when. The investors' reaction is evident in the USD/JPY chart: a local maximum was recorded at 149.57, with the week's final note hitting at 149.25.
● Regarding the near-term outlook for USD/JPY, experts' opinions are evenly divided: a third anticipate further growth, another third expect a decline, and the remaining third have chosen to remain neutral. Trend indicators and oscillators on D1 unanimously point north, indicating bullish sentiment, but 25% of the oscillators are in the overbought zone. The nearest support level is located in the zone of 148.25-148.40, followed by 147.65, 146.85-147.15, 145.90-146.10, 144.90-145.30, 143.50, 142.20, and 140.25-140.60. Resistance levels are found at 149.65-150.00, 150.75, and 151.70-151.90.
● Among the significant events related to the Japanese economy, the publication of the country's GDP data on Thursday, February 15, stands out. Traders should also be aware that Monday, February 12, is a public holiday in Japan: the country observes National Foundation Day.
CRYPTOCURRENCIES: Why Bitcoin Is Rising
● "Halving: Grief or Joy?" was the question we posed in the title of our previous review. The debate on this matter does not subside but, on the contrary, becomes more intense as April approaches.
The process of profit-taking after the approval of bitcoin spot ETFs on January 10 has ended. However, a new threat looms over the market now. And this threat is the miners. Scott Melker, a renowned trader, investor, and host of the podcast "The Wolf of All Streets," writes the following: "The bitcoin halving will occur when the number of mined blocks reaches 840,000 in April 2024, at which point the block reward will decrease from 6.25 to 3.125 BTC. Essentially, this means that the issuance of new coins will be halved. It will become twice as hard for miners to earn money from mining bitcoin."
The halving is tentatively scheduled for April 19, meaning there are roughly two months left. If the price of digital gold does not show significant growth in this period, the majority of miners will face a sharp liquidity shortage. Therefore, to replenish their liquidity, they may start actively selling their BTC holdings, which would exert significant pressure on the market.
According to estimates, bitcoin miners still had about 1.8 million BTC worth approximately $85 billion (at current prices). And now, CryptoQuant has announced that the reserves of these companies have fallen to their lowest level since July 2021. Currently, the wallets of mining pools hold the lowest volume of cryptocurrency since the so-called "Great Migration" of miners from China to other countries in Eurasia and North America. Coins have moved from miners' autonomous wallets to exchanges.
Bitfinex also observes an influx of bitcoins to exchange addresses associated with mining companies. Analysts believe that at some point, a large-scale coin dump could occur, which is concerning. However, miners are holding onto their reserves for the time being, despite reduced transaction fee revenues. According to CryptoQuant, their daily sales have dropped and are now less than 300 BTC.
The situation of mining companies is also complicated by the decline in the production volumes of new coins. According to TheMinerMag, BTC mining by U.S. miners dropped to historical lows in January due to a 29-50% increase in electricity tariffs. High electricity costs are expected to persist until the end of Q1 2024. Therefore, if the trend continues, a certain bitcoin supply deficit will be observed before the halving amid growing demand. And the fact that demand is increasing is confirmed by analysts at Santiment, who note a sharp increase in the number of "whales" owning more than 1,000 BTC. Naturally, this pushes BTC/USD upwards.
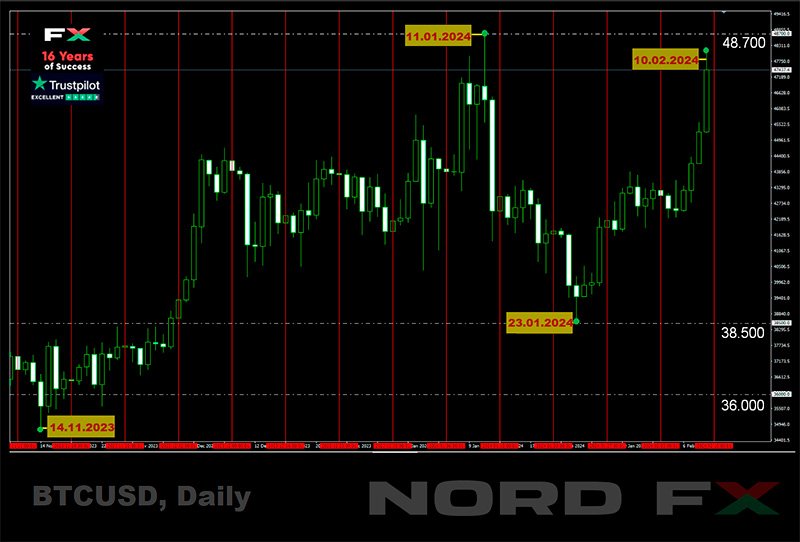
● From February 7 to 9, bitcoin's price showed a sharp surge, reaching a peak of $48,145. In this rally, in addition to the reasons mentioned, the global increase in risk appetites of major investors likely played the most significant role. The inflow of capital into stock markets also benefited the crypto market. According to IntoTheBlock, the correlation between bitcoin and the S&P 500 index was negative at the end of January but has since returned. Another reason some experts cite for the digital gold's price increase is the approach of the New Year according to the Chinese calendar. It is noted that the price of cryptocurrency always rises in anticipation of this date.
● Overall, most forecasts for the entirety of 2024 look quite optimistic, with some being very optimistic. Scott Melker, for instance, believes that the halving could lead to a rise in bitcoin's price to $240,000. "After the previous halving, the BTC price updated its maximum from $20,000 to $69,000, which is a 250% increase," he writes. "Thus, if the situation repeats this time, the next maximum after $69,000 will be $240,000." "I know it might seem like an exaggeration," Melker continues. "This cycle has worked in the past. But until I see it fail [this time], I'm willing to bet that bitcoin will exceed $200,000."
● According to ARK Invest CEO Cathy Wood, investors have begun shifting from gold to bitcoin following the launch of spot Bitcoin ETFs. "Bitcoin is growing relative to gold. The substitution of gold with bitcoin is in full swing. And we think this will continue...," she stated.
Echoing Cathy Wood's sentiment is the popular blogger and analyst PlanB. "After the upcoming halving, bitcoin will become scarcer than gold and real estate," he writes. "This implies that the cryptocurrency could reach a price of around $500,000." Based on his Stock-to-Flow model, the expert suggested that the market capitalization of the digital asset might not surpass that of gold – over $10 trillion. However, approaching this mark and a supply limit of 20 million coins would lead to the stated price. PlanB did not specify a timeframe for reaching this price, but he did mention a minimum price level that, in his opinion, the primary cryptocurrency will not fall below. According to PlanB, the BTC price has historically never dropped below the 200-week moving average. (At the time of writing the review, the 200WMA is around $32,000). Another analyst, known by the nickname ali_charts, believes that the critical support level is now $42,560.
● Renowned trader, investor, and founder of MN Trading, Michael Van De Poppe, like PlanB, believes that the value of bitcoin could reach $500,000. The expert highlighted that there are numerous factors that will cause explosive growth in the flagship coin's rate. Among these are the current state of the market, the launch of BTC ETFs, inflow of funds from institutional investors, among others. The halving is considered a significant factor, after which a bullish growth of the cryptocurrency market is expected. Van De Poppe suggests that the current cycle might be slightly longer than previous ones, due to the entry of institutional players into the market and changes in the overall direction of industry development.
Van De Poppe believes that a scenario where the value of bitcoin soon reaches the key resistance level of $48,000 is quite plausible. This would be followed by another correction, resulting in a 20% price drop to $38,400. After the halving, the value of BTC will begin to rise again and reach a local peak by the autumn.
● Elon Musk's company xAI developed Artificial Intelligence Grok, which has made two predictions regarding Ethereum, the main competitor to the leading cryptocurrency: 1) by the end of 2024, the price of ETH will range from $4,000 to $5,000; 2) within the year, the value of ETH could peak at $6,500. Grok highly values Ethereum's prospects due to the development of this altcoin's ecosystem and the Dencun update. This upgrade will increase the ETH blockchain's scalability level and significantly reduce transaction processing costs. The Dencun deployment took place in the Goerli test network on January 17th, and in the Sepolia test network on January 30th. The launch of Dencun in the main network is scheduled for March 13th. (It's worth noting that this update has already become one of the reasons why large ETH coin holders have started moving their assets from long-inactive wallets. Recently, such a "whale" moved 492 ETH worth over $1.1 million from a wallet that had been dormant for more than eight years).
Grok also considers the potential approval of spot Ethereum ETFs by the end of May as a catalyst for the altcoin's price growth. Six major American companies have submitted applications for these derivatives to the U.S. Securities and Exchange Commission (SEC).
However, the situation is not so straightforward. We have previously quoted SEC Chairman Gary Gensler's statement that positive decisions regarding spot ETFs exclusively concern bitcoin-based exchange products. According to Gensler, this decision "in no way signals a readiness to approve listing standards for crypto assets that are securities." Recall that the regulator still refers to bitcoin as a commodity, while "the vast majority of crypto assets, in his view, are investment contracts (i.e., securities)."
Last week, it was revealed that the SEC had postponed its decision on applications from Invesco and Galaxy. The agency had previously postponed the review date for other applications. "The only date that matters for spot ETH-ETFs at the moment is May 23. This is the deadline for the VanEck application," Bloomberg notes.
Analysts at investment bank TD Cowen believe it is unlikely that the SEC will make any decision before the second half of 2024. "Before approving an ETH-ETF, the SEC will want to gain practical experience with similar investment instruments in bitcoins," commented Jaret Seiberg, head of the TD Cowen Washington Research Group. TD Cowen believes the SEC will return to the discussion of Ethereum ETFs only after the U.S. presidential elections in November 2024.
Senior JP Morgan analyst Nikolaos Panagirtzoglou also does not expect the prompt approval of spot ETH-ETFs. For the SEC to make a decision, it needs to classify Ethereum as a commodity, not a security. However, JP Morgan considers this event unlikely in the near future.
● The cryptocurrency market has shown impressive growth over the past week. As of the evening of February 9, BTC/USD is trading in the $47,500 zone, and ETH/USD at $2,500. The total market capitalization of cryptocurrencies is $1.78 trillion (up from $1.65 trillion a week ago). The Crypto Fear & Greed Index has risen to 72 points (from 63 a week ago) and remains in the Greed zone.
NordFX Analytical Group
Notice: These materials are not investment recommendations or guidelines for working in financial markets and are intended for informational purposes only. Trading in financial markets is risky and can result in a complete loss of deposited funds.
Go Back Go Back
