First, a review of last week’s forecast:
- Seeing that EUR/USD had been oversold, both analysts and technical analysis expected it to bounce up, which is what happened. However, the bullish force in this case was only powerful enough to lift the pair to 1.0690 (as opposed to the expected 1.0750), after which the pair fell to the support area near 1.0610;
- A rebound of GBP/USD was expected as well. The reason for this forecast was the area of a strong medium-term support, which the pair had been near to. The height of 1.2500 was named as a target: the pair reached it in the first half of the week, and subsequently decided to take a break for almost a day. Then, having gathered its forces, it rose by another 75 points, reaching the height of 1.2575 on Thursday;
- As for the future of USD/JPY, everyone - experts, graphical analysis, and indicators - expected the pair to retest the local minimum at 110.00. The minimum did indeed turn out to be local: the pair easily overcame this barrier and fell by another 140 points by the end of the weekly session;
- USD/CHF. Here, about one quarter of analysts and graphical analysis on H4 expected that the pair would continue to move in the downward medium-term channel (this channel started in December 2016 and is clearly visible on D1 and W1), and would strive to reach its centre line in the 0.9950 area. The pair did indeed move southwards the entire week, resting on the upper boundary of the channel; it could not, however, overcome the symbolic support at 1.0000 and completed the week-long session near the 1.0050 horizon.
Forecast for the coming week:
Summarizing the views of a number of analysts from leading banks and brokerage firms, as well as the forecasts made on the basis of a wide variety of technical and graphical analysis methods, we can say the following:
- EUR/USD. Here most analysts (60%), supported by nearly 90% of indicators, still side with the bears, waiting for the pair’s fall to the 1.0500 zone. An alternative point of view is expressed by graphical analysis on H4 as well as 40% of experts. According to them, the pair, whilst moving in the medium-term rising channel that began in December 2016, will first grow to 1.0690 and then by another 130 points to 1.0820;
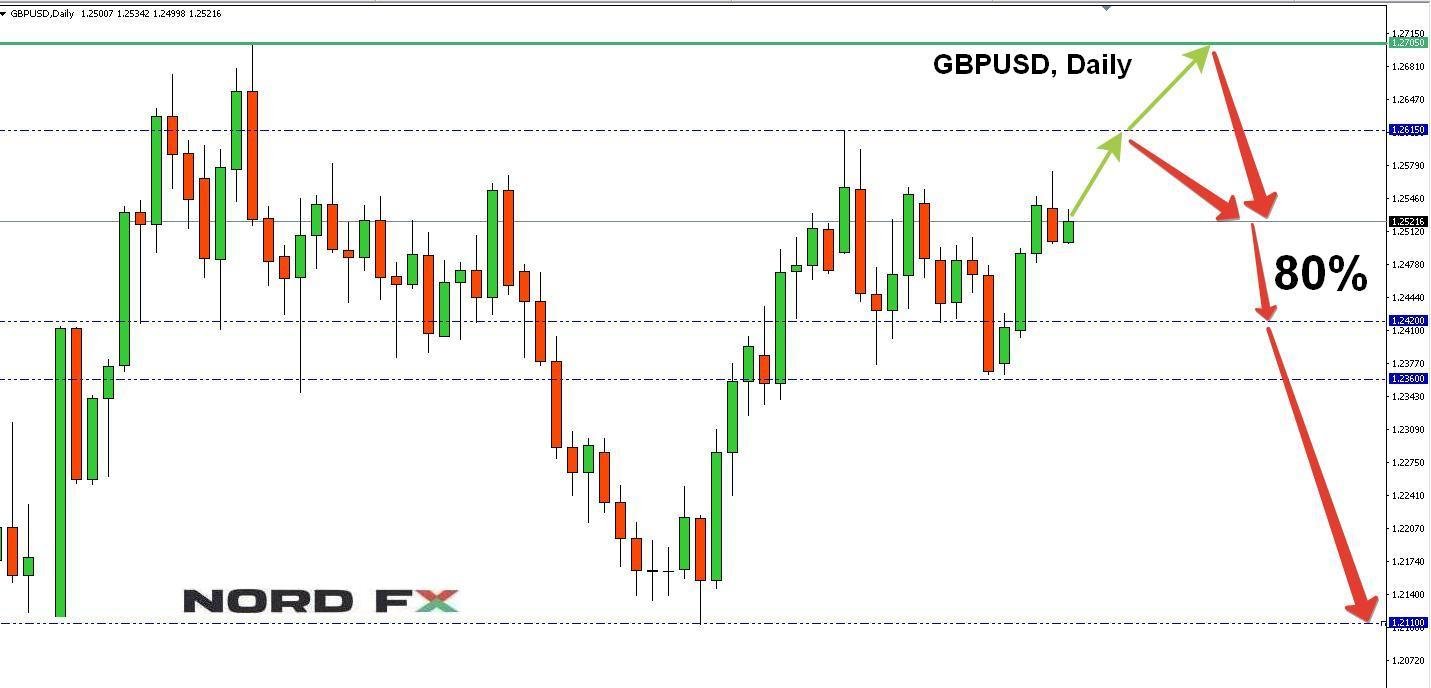
- in the medium term, nearly 80% of experts expect a falling GBP/USD (support 1.2420, 1.2360 and 1.2110). As for the immediate future, most analysts (60%), supported by both oscillators and trend indicators, lean towards the view that the upward momentum has not yet been exhausted, and that the pair will reach at least 1.2615. The next resistance is at 1.2375;

- there is a discrepancy between the weekly and medium-term forecasts for USD/JPY as well. So, if in the short term, 70% of analysts speak of the continuation of the downward trend to 107.50-107.85, the monthly and quarterly forecasts point northwards. The targets remain the same: 112.00 and 113.55. As for technical analysis, here the forces are distributed in the following way: graphical analysis on D1, 100% of trend indicators and 95% of oscillators side with the bears. On the side of the bulls, 5% of the oscillators that fix the extent of the pair’s overselling and graphical analysis on H4 both predict its growth to 110.50;
- USD/CHF. For the week to come, half of the analysts, along with graphical analysis and trend indicators on H4, expect the pair to move in the lateral channel of 1.0008-1.0100. The other half of experts, supported by the oscillators on H4, vote for its descent into the 0.9980 zone. As for the medium-term forecast, here almost 60% of analysts look northwards to 1.0170. Both oscillators and trend indicators on D1 agree with this point of view.
Roman Butko, NordFX
Go Back Go Back
