Major markets ended the week with a cautious, slightly risk-off tone. The minutes of the latest Federal Reserve meeting confirmed that quantitative tightening is likely to end in early December and showed policymakers still divided over whether to deliver another rate cut at the December meeting. The debate comes against a backdrop of resilient activity data: preliminary business surveys for November point to ongoing expansion in the US, while euro area indicators remain slightly above the 50.0 threshold but still highlight manufacturing weakness.
The macro picture into late November is therefore one of steady but uneven global growth. In the United States, markets are waiting for the next batch of data on Q3 GDP revisions, personal income and spending and inflation to clarify how quickly monetary policy might ease in 2026. In Canada, October inflation has moved closer to the central bank’s target range, adding to the impression that the peak in policy rates is behind us. Together with US housing and confidence figures due in the coming days, these releases will help shape expectations for the December Fed decision at a time when markets still price a significant, but no longer one-way, probability of another cut.
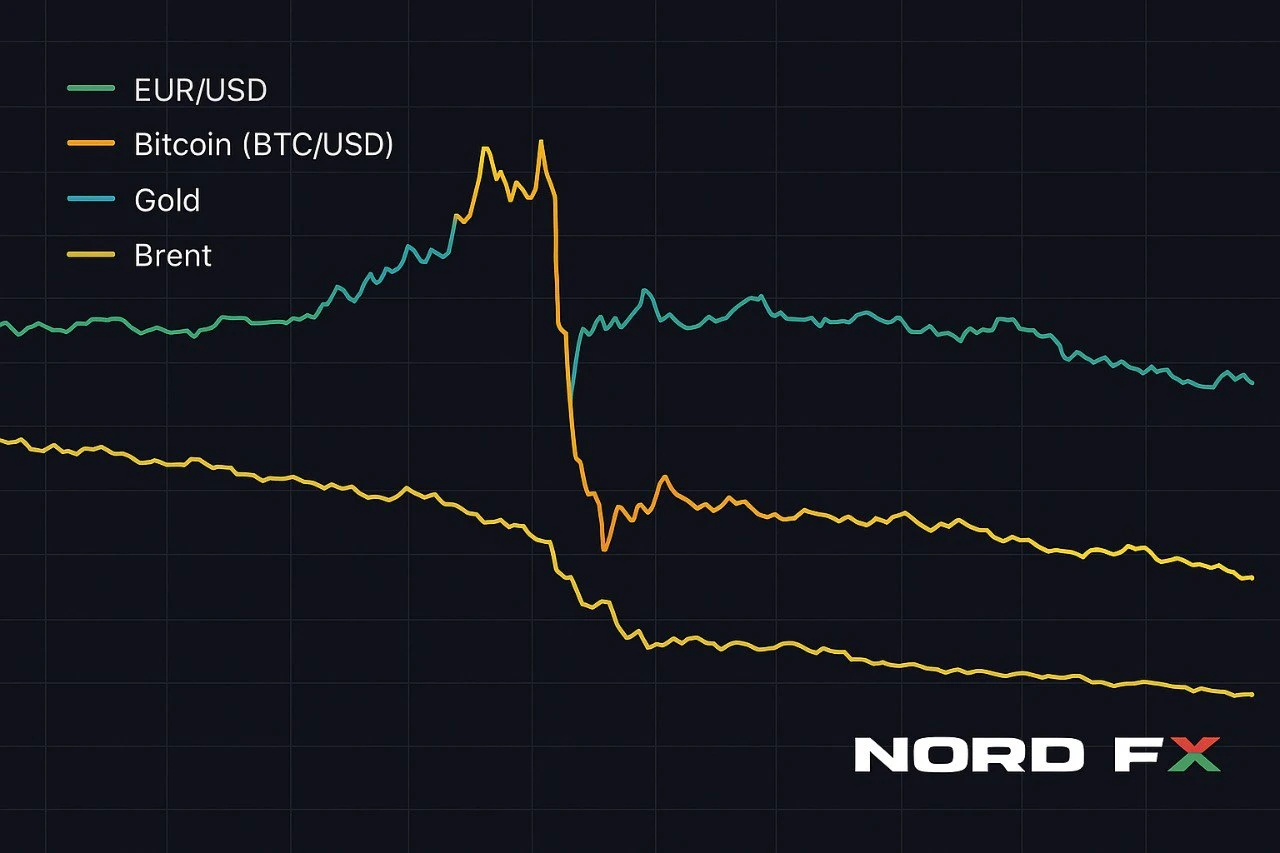
Against this backdrop, EUR/USD slipped back toward the mid-1.15s and finished Friday at 1.1513, having traded between 1.1490 and 1.1553 during the session. GBP/USD closed the week around 1.31 after moving in a 1.3040–1.3110 range. Gold is consolidating a little below recent highs, with spot prices near 4,066–4,080 dollars per ounce at the close on Friday. Brent crude has retreated to the low 60s, finishing the week close to 62.5 dollars per barrel. The cryptocurrency market remains under heavy pressure as bitcoin trades in the mid-80,000s and is on track for its worst month since 2022.
Overall, the week of 24–28 November is likely to be driven by incoming US data, any fresh commentary from Fed officials and how risk appetite evolves after a sharp drawdown in high-beta assets such as cryptocurrencies.
EUR/USD
EUR/USD spent most of last week trading around the 1.15–1.16 region. Intraday on Friday, the pair briefly moved higher toward 1.1550 ahead of euro area data, but stronger-than-expected US business-activity readings and firm US yields later pushed it back down. By the close, EUR/USD was at 1.1513, with the day’s high at 1.1553 and the low at 1.1490, leaving the dollar modestly stronger on the week.
On the euro area side, the November flash composite PMI remains slightly above the 50 mark, pointing to continued expansion, but the manufacturing component has slipped deeper into contraction and employment indicators are soft. In contrast, US surveys show a somewhat firmer picture, especially in services. The relative growth and yield backdrop therefore still favours the dollar at the margin, especially while euro area inflation converges toward the ECB’s target and the central bank signals a prolonged pause rather than imminent easing.
Technically, EUR/USD remains inside the broad consolidation range that has been in place since late summer. The 1.1490–1.1470 area now represents the nearest key support zone, as it coincides with Friday’s low and the lower boundary of a short-term range. A convincing break below it would expose the 1.1400–1.1365 band and increase the risk of a deeper correction toward the early-October troughs. On the topside, initial resistance lies in the 1.1620–1.1660 zone, where short-term moving averages and a descending trend line from the November high converge. A daily close above 1.1760–1.1800 would be needed to signal that the pair is ready to resume its longer-term advance toward the 1.20–1.22 region.
Baseline view: neutral with a slightly bearish tilt while the pair trades below roughly 1.1660. Short-term rebounds toward 1.16–1.17 remain possible if upcoming US data disappoint or if Fed communication sounds more dovish than the market expects, but the euro is still vulnerable to renewed selling on strong numbers or any further repricing of December rate-cut odds.
Bitcoin (BTC/USD)
The cryptocurrency market is finishing November under intense pressure. After setting record highs above 120,000 dollars in October, bitcoin has lost more than a third of its value in just a few weeks. According to several major venues, BTC/USD briefly dropped into the 80,000 area on Friday, with intraday lows around 80,700–81,600 dollars, before recovering part of its losses. By the end of the day, it was trading roughly in the 84,000–85,000 zone, and on Saturday it is fluctuating near 84,000–84,500 dollars.
Several forces are driving the move. A wave of leveraged long liquidations and profit-taking after an exceptionally strong year has collided with a less aggressive outlook for Fed easing and broader risk aversion. Flows into bitcoin-linked funds have slowed or turned negative, and some investors are rotating toward cash and high-grade bonds now that real yields remain positive even after earlier rate cuts. This has amplified volatility in a market where liquidity has thinned in the wake of October’s sharp selloff.
From a technical perspective, BTC/USD has clearly broken below its former support band in the 92,000–95,000 area and is now trading inside a steep descending channel. Shorter-term moving averages have rolled over, and momentum indicators are in oversold territory but have not yet shown a convincing bullish divergence. The nearest support zone is now located around 80,000–78,000 dollars, where the recent lows and an earlier consolidation cluster coincide. If this area fails to hold, the next downside targets will be in the 76,000–72,000 bracket, roughly corresponding to the April lows. On the upside, the former support area around 92,000–95,000 has turned into the first major resistance. Only a sustained move back above 100,000–105,000 would suggest that the corrective phase is ending rather than evolving into a more prolonged bear market.
Baseline view: neutral-to-bearish while bitcoin remains below the 92,000–95,000 resistance band. Short-term rebounds are possible given the degree of oversold conditions, but for now they look more like corrective bounces within a broader downtrend than the start of a new impulsive rally.
Brent Crude Oil
Brent crude futures extended their decline last week. The front-month contract for January is trading in the low 60s, with the current price around 62.5 dollars per barrel and a recent trading range roughly between 61.9 and 63.1 dollars. This leaves Brent near the lows of the current move and down noticeably from levels seen earlier in the autumn.
Oil remains under pressure from a combination of ample supply, rising US inventories and renewed hopes for progress toward a political settlement in Eastern Europe, which would reduce the risk of more severe disruptions to Russian exports. At the same time, demand concerns persist as global manufacturing and trade continue to lag behind services and as relatively high real interest rates weigh on investment and consumption decisions.
Technically, Brent is still trading inside a broad descending channel that has been in place since Q2 2025. Sellers have repeatedly emerged near the 66–68 dollar region, while buyers step in close to the 60–61 dollar support band. The latest decline has brought prices back toward the lower half of this range. A daily close below 61–60.5 dollars would confirm that bearish pressure is increasing again and could open the way toward 58 dollars and the lower boundary of the channel. On the topside, initial resistance now lies near 64–65 dollars; only a sustained break above 68–70 dollars would signal that a more durable bullish reversal is under way and shift focus back to the 74–76 dollar area.
Baseline view: neutral-to-bearish while Brent trades below roughly 68 dollars per barrel. In the absence of a major supply shock, rallies toward resistance are more likely to attract selling interest, especially if incoming data or Fed communication revive concerns about slower global growth.
Gold (XAU/USD)
Gold continues to behave more like a consolidation asset than a straightforward trend trade. Depending on the data source, spot XAU/USD closed on Friday between roughly 4,066 and 4,080 dollars per ounce, with one widely watched series showing a close near 4,078.5 dollars after a session range of about 4,023–4,101 dollars. Today, Saturday, trading indications are only slightly lower, suggesting ongoing consolidation after the recent peak above 4,300 dollars.
Although this represents a modest pullback from record levels, the broader uptrend remains intact and year-to-date gains are still substantial. Fundamentally, gold is supported by several factors: inflation in many major economies remains above target, real yields are positive but not high enough to eliminate the appeal of hedging assets, fiscal concerns in a number of countries are persistent and geopolitical risks remain elevated. At the same time, the Fed’s debate over further easing caps the upside in the short term, because a more hawkish-than-expected tone could drive another bounce in the dollar and real yields.
On the charts, XAU/USD is still trading inside a wide ascending channel that has been developing since early 2024. The 3,980–4,000 dollar area now represents the nearest important support, combining recent local lows with the lower edge of a short-term consolidation zone. A deeper decline toward 3,930–3,900 dollars cannot be ruled out if the dollar continues to recover or if US data next week come in stronger than expected, but at current levels such dips would likely be seen by many medium-term investors as an opportunity to rebuild long positions. On the upside, resistance is clustered between 4,130 and 4,180 dollars; a daily close above this area would suggest that the corrective phase is over and refocus attention on the record zone around 4,250–4,300 dollars and potentially higher.
Baseline view: buy-on-dips bias while XAU/USD holds above roughly 3,900 dollars. The next significant move is likely to depend on how the market interprets the combination of US GDP and inflation data and whether Fed messaging shifts expectations for real interest rates in 2026.
Conclusion
The week of 24–28 November finds markets at an important crossroads. The Fed has signalled an approaching end to quantitative tightening but has not yet committed to another rate cut in December, and incoming data on US growth and inflation will have a decisive influence on that debate. Euro area and UK activity indicators point to ongoing, if modest, expansion, but the region remains sensitive to any renewed tightening of global financial conditions.
In this environment, EUR/USD continues to trade inside a broad consolidation range, gold is pausing after a powerful rally but still looks supported on dips, and Brent remains capped by concerns over demand and supply normalisation. bitcoin, meanwhile, has reminded traders how quickly sentiment can reverse in high-beta assets: the coin has given back a large portion of its 2025 gains in just a few weeks as leverage and optimism have unwound and liquidity has thinned.
As always, traders should stay flexible, pay close attention to the technical levels highlighted above and monitor key macro releases and central bank signals in the days ahead. Volatility may rise sharply if data or Fed communication materially change expectations for the path of interest rates and global growth.
NordFX Analytical Group
Disclaimer: These materials are not an investment recommendation or a guide for working on financial markets and are for informational purposes only. Trading on financial markets is risky and can lead to a complete loss of deposited funds.

