EUR/USD: Back to 1:1 Parity
- EUR/USD has been moving sideways in the 1.0100-1.0270 channel for more than three weeks. All attempts to break through its upper or lower border ended in failure. This movement continued until August 10, when, after the publication of data on inflation in the US, the pair went up sharply, turning the level of 1.0270 from resistance into support. However, the bulls' joy was short-lived. Just two days later, the pair returned to the channel, broke through its lower border on Thursday, August 18, and ended the week at 1.0039.
So, as most experts expected, the dollar and the euro approached the parity of 1.0000 again. There are two main reasons explaining the next reversal of the pair to the south. The first is the drop in the market's risk appetites. Inflation and the energy crisis in Europe are on the rise. The consumer price index (CPI) rose there in annual terms from 8.6% to 8.9% in July. So far, there is no way out of the energy crisis caused by the sanctions imposed on Russia because of its invasion of Ukraine. The Chinese economy is not encouraging either: the volume of industrial production (y/y) fell from 3.9% to 3.8% over the month, which is much lower than the forecasted 4.6%. The volume of retail sales fell from 3.1% to 2.7% as well (against the forecast of 5.0%). Against this background, the People's Bank of China lowered the base lending rate on the yuan sharply, from 3.70% to 2.75%.
The second reason lies in the positive macroeconomic statistics from the US and investors' confidence in the strength of the country's economy. It is known that the main "whales" that now determine the Fed's monetary policy are the state of the labor market and inflation. Unemployment in the US has been holding at 3.6% since March, which is a very good indicator. And it became even lower in July, 3.5%. And such an important indicator as NFP, the number of new jobs created outside the agricultural sector, with a forecast of 250K, actually reached 528K. And this despite the fact that it was 372K a month earlier. As for inflation, the figures look quite good here as well. The consumer price index (CPI) with a forecast of 0.2% in July turned out to be at the level of 0.0% (1.3% a month earlier). It decreased from 9.1% to 8.5% (forecast 8.7%) on an annualized basis. Instead of the expected 0.5%, the base CPI grew by only 0.3% in July (0.7% a month earlier).
All these figures indicate clearly that inflation, the war against which the Fed launched, is declining. Of course, this is not a final victory, but the success of the American Central Bank is obvious. Therefore, it may soften its monetary policy somewhat and not raise interest rates as aggressively as it has done in the past two months. It was this logic that played against the dollar, pushing EUR/USD up to 1.0368 on August 10. However, everything returned to normal soon. Fed chief Jerome Powell assured everyone that the regulator remains hawkish. The markets made the same conclusion from the minutes of the July meeting of the FOMC (Federal Open Market Committee) published on Wednesday, August 17.
It is expected that the American Central Bank may raise the rate from the current 2.5% to 4.0% by the end of 2022 - the beginning of 2023, and possibly to 5.0%, after which it will hold it in order to bring inflation down to the target level of 2%. This means that the dollar will be strong enough for a long time to come. This forecast pushed up the USD DXY Index again. Following this, the yield of US government bonds and securities of other developed countries began to grow, and stock indices (S & P500, Dow Jones and Nasdaq), cryptocurrencies and other risky assets rushed south. Having believed in the rate hike and the prospects for the dollar, investors even began to get rid of such a protective asset as gold: the quotes of XAU/USD were falling throughout the past week.
As for the near future of the EUR/USD pair, at the time of writing the review, on the evening of August 19, only 15% of experts speak in favor of its growth, a little more indicate the way for it to the south - 25%, the remaining 60% refrain from forecasts. The readings of the indicators on D1 give much more definite signals. 100% side with the bears both among trend indicators and among oscillators. However, a third gives signals of it being oversold among the latter.
Apart from the support at 1.0030, the immediate target for the EUR/USD pair is, of course, the 1.0000 level. After it is broken, the bears will target the July 14 low at 0.9950, even lower is the strong 2002 support/resistance zone 0.9900-0.9930. The immediate target for the bulls is a return to the zone 1.0070-1.0100, then resistance and zones 1.0120, 1.0150-1.0180, 1.0200 and 1.0250-1.0270 follow. More distant targets are located in the zones 1.0400-1.0450, 1.0520-1.0600 and 1.0650-1.0750.
Upcoming events include the release of the German and Eurozone Manufacturing PMIs on Tuesday, August 23. The volume of orders for capital goods and durable goods in the US will be known the next day. There will be a whole series of events on Thursday, August 25. Firstly, this is the publication of data on German GDP for Q2. Then, the publication of the minutes of the ECB meeting on monetary policy. And finally, four important events in the US that could seriously affect the current trend of the dollar. Data on GDP for Q2 and on unemployment will be published on August 25, and the Personal Consumption Expenditure Index (PCE), which is called "the Fed's favorite inflation indicator," will become known on August 26. The release of all these statistics will coincide with the annual economics symposium in Jackson Hole on August 25-27. The US financial authorities discuss the most important economic issues there, and these indicators are sure to influence their decisions.
GBP/USD: Gloomy Forecasts for the Pound Continue to Come True
- GBP/USD rushed down again after US Federal Reserve officials pointed to a further sharp increase in interest rates. It was further accelerated by speeches by a number of Fed officials, including the head of the Federal Reserve Bank of St. Louis James Bullard and his colleague from the Federal Reserve Bank of San Francisco Mary Daley. One can conclude from their hawkish attitude that the dollar interest rate will probably be increased by 75 basis points (bp) in September for the third time in a row. At the same time, the head of the Kansas City Fed, Esther George, said that the regulator would tighten monetary policy until it was completely sure that inflation was on the decline.
Statements by US officials caused GBP/USD to drop 344 points in five days from 1.2135 to 1.1791 from 1.2135 and end the week slightly higher at 1.1830. The pound was not helped even by the unexpected growth of retail sales in the UK in July by 0.3%. UK shoppers spent more than expected thanks to online sales promotions. The rest of the macro statistics came out ambiguous. The average wage rate, with a forecast of 4.5%, was 5.1%, and the number of applications for unemployment benefits fell from 28.8K to 10.5K over the month. However, despite some improvements in the labor market, inflation in the UK exceeded the expected 9.8% and reached 10.1% (against 9.4% a month earlier). According to the forecast of the Bank of England, the recession in the country will probably begin in Q4 and may last more than a year.
GBP/USD fell to its lowest level in the last 5 weeks and, according to 30% of analysts, may continue to fall. Corrections to the north are also expected by 30%, the remaining 40% of experts remain neutral. The indicator readings on D1 look exactly the same as those of the EUR/USD pair: all 100% are colored red, while 30% of the oscillators signal that the pair is oversold. Immediate support is at 1.1800, followed by July 14 low at 1.1759, followed by 1.1650, 1.1535 and March 2020 lows in the zone 1.1400-1.1450. As for the bulls, they will meet resistance in the zones and at the levels of 1.1875-1.1925, 1.2000, 1.2050-1.2075, 1.2160-1.2200, 1.2275-1.2325 and 1.2400-1.2430.
With regard to the economic statistics of the United Kingdom, there will be data on business activity in various sectors of the country's economy on Tuesday, August 23. The values of the Business Activity Index in the manufacturing sector, the service sector, as well as the Composite Index (PMI), which reflects the level of activity of purchasing managers in both sectors of the UK economy, will become known.
USD/JPY: Japan's GDP Grows, Yen Rate Falls
- The growth of the DXY Index, which shows the ratio of the US dollar to a basket of six other major foreign currencies, as well as the growth of US Treasury yields, has evidently affected the dynamics of USD/JPY. The pair, starting from 133.45, rose to the height of 137.22 during the weekly trading session, and set the last chord at 136.81.
The data released on Monday, August 15, made the prospects for monetary tightening by the Bank of Japan even more uncertain. If this world's third largest economy fell by 0.1% in Q1, it showed a steady growth of 0.5% in Q2 (slightly less than the expected 0.6%). On an annualized basis, the Japanese economy, with a forecast of +2.5%, actually grew by 2.2% (there was a contraction of -0.5% in the previous quarter).
GDP is the main macroeconomic indicator of market activity that assesses the rate of growth or decline of a country's economy. Usually its growth is positive bullish, factor for the national currency. Usually, but not in these times, when the attractiveness of a particular currency is determined by the size of interest rates. And according to this parameter, the yen is far behind the US dollar.
According to economists from the international financial group Nordea, “The continuation of the Fed's policy of tightening monetary policy, along with most other G10 central banks, will keep pressure on the Japanese yen. […] Without any change in monetary policy from the BOJ, which we do not expect for the foreseeable future, the door will be open for the Japanese yen to hit 140 against the dollar again.” At the same time, according to the strategists of another bank, the Australian Westpac, the pair may drop to 123.00 in the longer term, by the end of 2023.
If we move on to the median forecast for the near term, it looks like this: 20% of analysts expect the pair to rise, 35% hope for the yen to strengthen and return to the downtrend, the remaining 45% talk about a side corridor. Trend indicators on D1 have 100% pointing north. As for oscillators, 90% are looking in the same direction, while 25% are in the overbought zone. The remaining 10% of the oscillators point east. Supports for the pair are located at the levels and in the zones 135.55-136.00, 134.00-134.25, 132.85-133.00, 131.75-132.00, 131.00. Resistances are 137.45, 137.90-138.40, 138.50-139.00, and finally the July 14 high at 139.38. Bulls' next targets are 140.00 and 142.00.
No significant statistics on the Japanese economy are expected to be released this week.
CRYPTOCURRENCIES: Bugatti Sports Car for 1 BTC: a Pipe Dream or Reality?
- Among the many questions that concern the crypto community, two main ones can probably be distinguished: 1) Who is Satoshi Nakamoto? and 2) How much will bitcoin be worth? The first of them will be answered by White Paper Films, which announced the start of work on a documentary film dedicated to the personality and mysterious disappearance of the creator of the first cryptocurrency. (By the way, you can find a lot of interesting information on this subject on the NordFX broker website). As for the second question, as usual, we will look for answers to it in this weekly review.
First, there is good news for those who are waiting for the major cryptocurrency to surge upwards. A new study by Glassnode has shown that despite the fall in the crypto market, the use of the bitcoin network continues to grow: the number of unique addresses has now peaked at over 1 billion. (For comparison: the main competitor of BTC, ethereum with 158 million addresses is far behind on this indicator).
Good news No.2. According to Arcane Research, miners sold 6,500 BTC in July. This is 60% less than in June, when 14,600 coins were sold. The fall of the crypto market has created a lot of serious problems for public mining companies that have increased their production capacity with borrowed funds. Faced with the crisis, they are forced to dump the mined coins at low prices in order to pay off their debt obligations. Some, in the end, had enough margin of safety and managed to survive, while others turned out to be bankrupt.
The July data gives a timid hope that the industry is recovering, the pressure of miners is weakening. They hold onto their coins in the hope that they will rise. However, Arcane Research notes that 6,500 bitcoins is still more than in May, when miners shocked the market by selling more coins than they mined.
Good news No.3. A number of technical indicators signal the increasing likelihood of bitcoin reversing towards sustainable growth. Thus, the Spent Output Profit Ratio (SOPR) indicator recorded a minimum on June 18, 2022. This indicator had lower values only in December 2018 and March 2020. Another indicator, RHODL indicates a significant predominance of long-term investors on the market over short-term ones. This means that the holders do not plan to sell their coins and are guided by the growth of the market in the future.
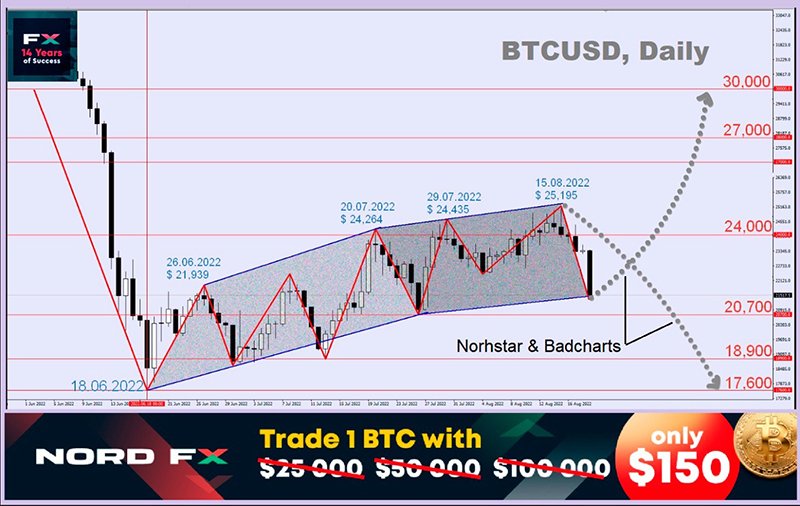
This is the end of the good news this week. Recall that the price of bitcoin fell to $17,597 on June 18, in line with December 2020 levels and almost 75% below its all-time high of $68,918. If we measure from the beginning of 2022, the main cryptocurrency started at $47,572 on January 01, and its fall was 63% by June 18. However, as the chart shows, bearish resistance sharply increased above $24,000 and the upward momentum began to fade rapidly. So, the weekly high was at a height of $24,264 on July 20, $24,435 on July 29, $24,891 on August 11, and, finally, $25,195 on August 15. That is, the uptrend seems to have continued, but the increase in highs was less than 4% over the past 4 weeks. And the past week has generally brought investors a complete disappointment.
As of this writing, Friday evening, August 19, the total crypto market capitalization is $1.028 trillion ($1.155 trillion a week ago). The Crypto Fear & Greed Index fell 9 points in seven days from 42 to 33 and came close to the Extreme Fear zone. BTC/USD has gone down sharply again and is trading at $21.095. There are several reasons for this fall. First, the intention of the Fed to continue raising rates, which became clear from the minutes of its last meeting. Secondly, there is strong downward pressure from the fever in the stablecoin market. First, aUSD was compromised, and HUSD, the token of the Huobi crypto exchange, lost its peg to the dollar last week. If we add to this the bankruptcy of a number of cryptocurrency funds, the pessimism that reigns in the market becomes clear.
Well-known analyst and DataDash founder Nicholas Merten noted that bitcoin and ethereum are showing signs of weakness despite their rising prices in recent weeks. According to Merten, the fact that the recovery of the stock market is ahead of the recovery of crypto assets suggests that the latter may not have much strength left to continue the rally. If cryptocurrencies sell out faster than stocks during a downtrend, then they should have recovered faster. But there is no such recovery at the moment.
Another crypto strategist, nicknamed Capo, believes that “there is a chance to see another attempt by the main cryptocurrency to storm the $25,400-$25,500 range.” However, according to his colleagues at Norhstar & Badcharts, there is a possibility that bitcoin could start to drop sharply to $10,000-$12,000. They explained their assumption in an interview with Kitco News as follows: “According to the chart, the price of bitcoin is in an inverted arc, opposite to the Cup pattern… There are a number of technical analysis methods that increase to 70-80% the probability that the price of bitcoin will make new lows of $10,000 -$12,000 and there's about a 20% to 30% chance it will go up." In the event that the bitcoin rate goes up, according to Norhstar & Badcharts, it could reach $29,000-$30,000. According to them, this is the maximum level that the value of BTC can rise to before it starts to fall. “We are either already at local peaks or very close to them,” Norhstar & Badcharts says.
As usual, influencers who have invested heavily in bitcoin are trying to knock down the wave of pessimism. They continue to convince everyone and everywhere of the fantastic prospects of the flagship cryptocurrency. For example, Anthony Scaramucci, former director of communications at the White House and now head of the investment company SkyBridge Capital, recalled in an interview with CNBC the limited issue of bitcoin of 21 million coins, which will lead to “shock demand with little supply.” Scaramucci believes that the first cryptocurrency can show unprecedented growth within six years. “If we're right, if bitcoin goes to $300,000 it won't matter if you bought it at $20,000 or $60,000. The future is ours. And it will happen sooner than I thought,” he says.
The former director of the White House is echoed by the former head of MicroStrategy Michael Saylor. Recall that this company acquired 129,698 BTC under his management. Despite the current unrealized huge losses on these trades, Michael Saylor is confident that the purchase of bitcoin as a reserve asset was justified, and the asset will prove to be reliable in the future. “We […] got into the lifeboat of the first cryptocurrency with the understanding that we would be tossed in the ocean, but we would not drown and would appreciate this step over time,” said Saylor. According to him, the volatility of cryptocurrencies will only affect short-term investors and public companies, so bitcoin is not for everyone. “The investment should be for a period of at least four years. Ideally, this is the transfer of wealth from generation to generation. The metric that confirms this is the four-year moving average,” he explains.
And at the end of the review, here is the statement of another bitcoin maximalist. “I still hope to buy a Bugatti for 1 BTC,” said Jesse Powell, CEO of the Kraken crypto exchange. Given that the cost of one Bugatti sports car can exceed $5 million, it takes very little to fulfill this dream: “just” to wait for bitcoin to rise in price by 250 times.
NordFX Analytical Group
Notice: These materials are not investment recommendations or guidelines for working in financial markets and are intended for informational purposes only. Trading in financial markets is risky and can result in a complete loss of deposited funds.
Go Back Go Back
