EUR/USD: Midpoint of the 'Dull Period'
● In the next part of the review, we will discuss how one crypto analyst used the term "dull period" in relation to the BTC/USD chart. The EUR/USD chart looks even more uneventful. While from 20 August until today, the pair fluctuated within the 1.1000-1.1200 range, last week it narrowed by another 50%, from 200 points to 100, settling in the 1.1100-1.1200 range. It appears the market has already priced in the forecasts for the US Federal Reserve rate cut, the actual moment of the cut on 17-18 September, and expectations regarding future monetary policy from both the US and European Central Banks.
● Of course, the pair's dynamics were influenced by events listed in the economic calendar. On Monday, 23 September, preliminary data on business activity (PMI) across various sectors of the economies of Germany, the Eurozone, and the US were released. On the European side of the Atlantic, PMI figures were uniformly in the red, indicating that business activity in both the manufacturing and services sectors is declining. The data was especially disheartening for Germany’s manufacturing sector, the engine of the European economy. Not only did it fall below the threshold of 50 points, which separates progress from regression, but it also reached a low of 40.3 points. In the US, manufacturing PMI also declined, but not as dramatically as in Germany, dropping from 47.9 to 47.0 points. As for the American services sector, it remained firmly in the green zone, standing confidently at 55.4 points.
● The data released on Thursday, 26 September, also indicated an expansion of the US economy. While GDP growth in Q1 stood at 1.6%, by the end of Q2, this figure had risen to 3.0%. Alongside GDP growth, the labour market showed a degree of stability. Instead of the forecasted rise to 224K, the number of initial jobless claims for the week actually fell from 222K to 218K. On the same day, market participants closely listened to statements by Fed Chair Jerome Powell and his ECB counterpart Christine Lagarde, but nothing new or sensational was announced.
As for inflation, a key indicator such as the Core Personal Consumption Expenditures (PCE) Price Index, which reflects price changes for a fixed basket of consumer goods and services purchased by US residents, increased year-on-year from 2.6% to 2.7%. However, on a monthly basis, it fell from 0.2% to 0.1%. These figures were released on Friday, 27 September.
● Against the backdrop of this PCE decline, the EUR/USD bulls made another attempt to push the pair to 1.1202, but once again, they failed to hold their ground. The final note of the trading week sounded in the middle of the channel at 1.1163.
● Expert opinions on the short-term behaviour of EUR/USD are divided as follows. During this "dull period," 40% of analysts are voting for a stronger dollar and a decline in the pair, while the majority (60%) have taken a neutral stance, and none are predicting growth. However, in the medium term, the number of those expecting the pair to rise increases to 30%. In terms of technical analysis on D1, 80% of trend indicators recommend buying, while 20% suggest selling. The oscillators show a more mixed picture: 25% are green, 25% are red, and the remaining 50% are in a neutral grey zone. The nearest support levels for the pair are around 1.1100, followed by 1.1000-1.1025, 1.0880-1.0910, 1.0780-1.0805, 1.0725, 1.0665-1.0680, and 1.0600-1.0620. Resistance zones are found around 1.1185-1.1210, 1.1275, 1.1385, 1.1485-1.1505, 1.1670-1.1690, and 1.1875-1.1905.
● The upcoming week promises to be quite eventful, interesting, and volatile. On Monday, 30 September, preliminary data on consumer inflation (CPI) in Germany will be released. On the same day, Federal Reserve Chairman Jerome Powell is set to give a speech. The following day, Tuesday, 1 October, the CPI figures for the Eurozone as a whole will be announced. Additionally, on 1 and 3 October, revised data on business activity (PMI) in various sectors of the US economy will be revealed. Furthermore, from 1 to 4 October, a wave of labour market statistics from the United States will flood in. The main focus will be on Friday, 4 October, when key figures such as the unemployment rate and the number of new jobs created outside the agricultural sector (NFP) will be published.
CRYPTOCURRENCIES: Is the 'Dull Period' Coming to an End?
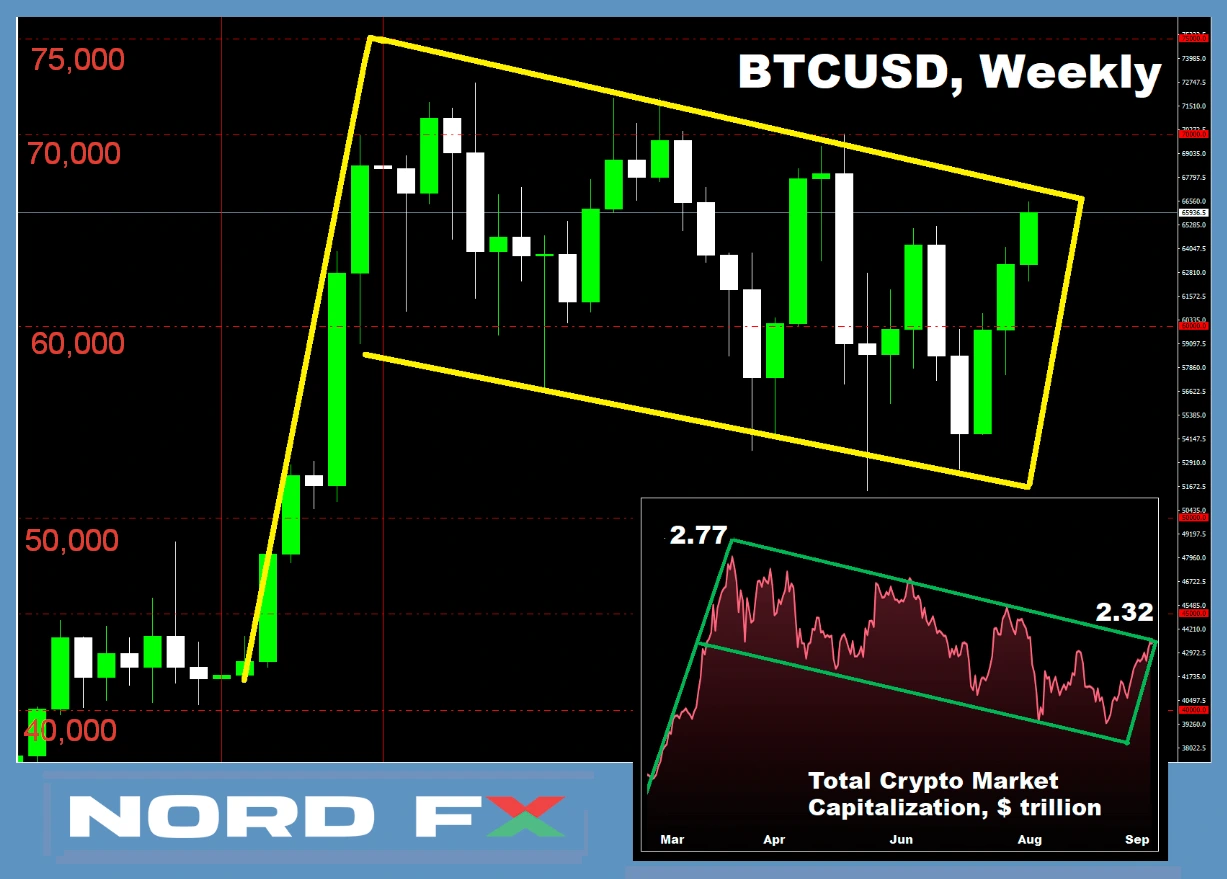
● In terms of technical analysis patterns, the launch of BTC-ETFs earlier this year led to the formation of a "flagpole" on the total cryptocurrency market capitalisation chart. Then, starting from 13 March, the flag's "body" began to take shape in the form of a fairly wide descending channel. A nearly identical pattern appeared on the BTC/USD chart. Thus, the market capitalisation peaked on 13 March at $2.77 trillion, while bitcoin recorded its all-time high (ATH) of $73,743. Six and a half months have passed since then, and the current capitalisation stands at $2.32 trillion, with bitcoin’s weekly local high reaching $66,517.
● The research firm Glassnode believes that the market is stuck in a consolidation phase due to a lack of capital. Glassnode notes that short-term speculators, holding cryptocurrency for less than 155 days, are selling more coins than they are buying. On the other hand, CryptoQuant highlights that after the early August low, when the leading cryptocurrency dropped below $49,000, even short-term holders are now "in profit." Analysts point out that the risk of large-scale bitcoin sales is currently at its lowest level since the beginning of 2024. "Over the past six months, the number of people willing to sell bitcoin has dropped to a minimum," they write. "The sell-risk ratio, which sums up all realised profits and losses on the network per day and divides this by bitcoin's realised capitalisation, is now below 20,000. For comparison, during the March peak, this figure reached nearly 80,000."
● It is worth noting that the last time such an extended consolidation period was observed in the digital gold market was four years ago. It occurred after the end of a powerful bull rally in Q2 2019 and lasted until September 2020. Following this, there was a fivefold price increase, with bitcoin reaching a new ATH of $58,783. Drawing a parallel to that period, many market participants are now hoping for a similar surge after the current accumulation phase by buyers concludes.
The analyst known by the pseudonym PlanB has stated that the current consolidation suggests that another explosive price increase is only a matter of time. He also points out that similar "dull" periods occurred not only in 2019 but also earlier. After such phases, in 2013, 2017, and 2020, we witnessed significant price movements. PlanB further emphasised that throughout bitcoin's history, spanning 162 months, only 27 of them (about 16.7%) have shown growth, yet that growth amounted to hundreds of thousands of percent.
● Analysts at 10x Research have identified two catalysts for a sharp rise in bitcoin. In their view, the triggers for a bull rally will be the US Federal Reserve’s interest rate cuts and the upcoming payouts to creditors of the bankrupt crypto exchange FTX. "The expected influx of $5-8 billion will excite investors," the experts suggest.
Moreover, they believe there is "a likelihood of a sharp, 'juicy' rise in cryptocurrency, as the Fed appears to have raised the level of the S&P 500 at which it will intervene to protect investors, signalling the possibility of further rate cuts. As a result, many investors will likely reposition their portfolios into risk assets by 2025," according to the 10x Research report.
● According to Bloomberg, following the Fed's rate cut at the 17-18 September meeting, the correlation between the crypto market and the US stock market neared a record high. The 40-day correlation coefficient between the 100 largest cryptocurrencies and the S&P 500 index reached approximately 0.67. (A higher mark of 0.72 was only achieved once, in Q2 2022). As a result, US stock indices (S&P 500, Dow Jones, and Nasdaq) reached new highs, while bitcoin approached the upper boundary of the "flag body" pattern.
● While 10x Research identified two reasons for bitcoin’s potential growth, Bernstein has counted as many as five. 1. Fed Rate Cuts and Inflation Hedging: Analysts note that bitcoin, like gold, becomes more attractive during times of fiscal excess, especially as US debt approaches $35 trillion. Since the beginning of the year, bitcoin has risen by 45%, compared to gold's 27% increase. 2. Growing Bipartisan Support for Cryptocurrencies: This is highlighted by statements from both Donald Trump and Kamala Harris, reflecting the increasing acceptance of crypto across political lines.
3. Popularity of Bitcoin ETFs: "In the past 10 days, inflows into bitcoin ETFs have reached $800 million, despite volatile price dynamics," Bernstein reports. The firm expects more banks, such as Morgan Stanley, to launch bitcoin ETFs, leading to further capital inflows. 4. Miner Stability After April's Halving: According to Bernstein, the network's hash power has recovered, indicating miner resilience and further strengthening bitcoin's fundamentals. 5. Decreased Selling Pressure: Large bitcoin sales by the US and German governments, as well as payouts to Mt. Gox creditors, have been absorbed by the market. Moreover, MicroStrategy has managed to raise $2.1 billion to purchase more bitcoin, bringing its holdings to 252,220 BTC, or 1.3% of the total supply.
● Bitget Research also highlights MicroStrategy's actions and the increased inflow of funds into bitcoin ETFs following the Fed's rate cuts. "This indicates that institutional players are optimistic about the market's prospects. With steady purchases, bitcoin is likely to break through previous highs," Bitget Research experts note. Additionally, they believe that the regulatory framework in the US is likely to undergo significant changes after the presidential elections in November, creating a favourable environment for investment in the crypto industry. Investor confidence in the market will grow, which will facilitate capital inflow and accumulation.
● Undoubtedly, political factors have a significant impact on the crypto market. Recently, the positive dynamics of bitcoin and leading altcoins were supported by a statement from Vice President Kamala Harris, who said that if she wins the US presidential election, she will promote increased investment in AI technologies and the cryptocurrency sector. Some experts have called Harris’s statement "encouraging" and "an important event for crypto and blockchain technologies." However, others, such as venture capitalist Nic Carter, have expressed the opposite view, claiming that Harris's words are politically motivated and "mean nothing." Charles Hoskinson, founder of Cardano and co-founder of Ethereum, also believes that none of the US presidential candidates will be able to create favourable conditions for the industry, as they lack the necessary knowledge of cryptocurrencies.
● Macroeconomist Raoul Pal expects bitcoin's price to soar to $200,000 or more by the start of next year. He identifies the primary driver for this as the easing of monetary policy by the Federal Reserve and other major central banks. In a video posted on his Real Vision channel, the former Goldman Sachs executive explained that the leading cryptocurrency tends to rise and fall along with global liquidity cycles. He presented a chart of the GMI (Global Macro Investor) index, which reflects an increase in global liquidity over the next three months, and analysed how this would impact BTC's price.
Pal also prepared another chart showing that BTC is exactly replicating its price movement from January 2023 to March 2024, when the price surged by approximately 350%, from $16,500 to nearly $74,000. According to the economist, "bitcoin is repeating what it did last year, almost exactly. So, we have the macro-overlay, the Fed will continue [easing], other central banks will also get involved. We have seasonality and the global liquidity cycle..." "This should happen now," Raoul Pal concludes. (The seasonal factor was also noted by analysts at 10x Research, who pointed out that historically, bitcoin has shown significant growth from October to March, and this trend could repeat, considering previous market cycles).
● Returning from fundamental to technical analysis, let’s recall some of the predictions based on chart patterns that we've previously discussed. About a month ago, the analyst known as Rekt Capital predicted a surge in the value of the leading cryptocurrency in October. His forecast was based on the "bull flag" pattern, which we mentioned at the beginning of this review, where the breakout height equals the height of the flagpole’s base. Another analyst, MetaShackle, relies on the "cup and handle" pattern. This forecast, which we detailed from 2-6 September, is another bullish chart formation that has been developing over the last three years. According to MetaShackle’s calculations, this pattern should lead the BTC/USD pair to rise to $130,870.
Recently, analyst and Factor LLC head Peter Brandt also referred to chart analysis in his forecast. The Wall Street legend believes that in 2025, the bitcoin-to-gold ratio could increase by more than 400%. Justifying his highly optimistic prediction, Brandt points to a classic technical model: the "inverse head and shoulders" pattern. This pattern forms under a resistance level called the neckline. The theory states that when resistance is broken, accompanied by rising trading volumes, the price climbs by the maximum distance between the neckline and the deepest point of the head.
Applied to the BTC/XAU chart, the price of 1 bitcoin could reach the equivalent of 123 ounces of gold by 2025, which is five times higher than the current 24.6 ounces as of 27 September 2024. In other words, assuming physical gold remains at its current level of $2,670, the price of digital gold, according to Brandt’s theory, could soar to over $328,000. Supporting the idea that bitcoin could surpass the precious metal is its rapid adoption by institutional investors, as well as the launch of bitcoin ETFs, which have increased the asset's presence in their portfolios.
● At the time of writing this review, on the evening of Friday, 27 September, the BTC/USD pair is trading in the $65,900 zone. The total cryptocurrency market capitalisation has increased by $220 billion, reaching $2.32 trillion (compared to $2.10 trillion a week ago). The Crypto Fear & Greed Index has risen from 54 to 61 points, moving from the Neutral zone to Greed. This trend supports the words of UFC fighter Renato Moicano, who urged the public to pay more attention to the leading cryptocurrency. "Bitcoin is not just an investment. It's a way of life," said the Brazilian, demanding that his prize for winning UFC 300 be paid in BTC.
CRYPTOCURRENCIES: ETH is No Longer the King of Altcoins. Long Live the New King?
● Despite the "dull period," the last three months have seen significant shifts in trends within the crypto market. Metrics show that among the 15 largest altcoins, Solana (SOL) has recorded the highest inflow of funds and continues to show steady growth. SOL's price has risen to $150, with a market capitalisation of around $69 billion and a trading volume of $2.34 billion. On the other hand, Ethereum has struggled, even with the title of the #1 altcoin. It has been unable to hold above $2,650 or surpass a market capitalisation threshold of $320 billion. The well-known blockchain has ceded its position to newer networks, registering the largest capital outflow since 13 March: more than $165 billion, a 33% decrease.
Solana has also faced losses. After reaching a peak of $203 in March, its value gradually declined, now standing at about $150. However, analysts at the investment firm VanEck foresee a bright future for SOL, predicting growth to $330. They base their forecast on the fact that Solana's blockchain outperforms Ethereum’s network in three key areas: 1. Solana's blockchain can process 31 times more transactions per second; 2. SOL's network is used by 14 times more people daily; 3. The cost of processing transfers on Solana's blockchain is significantly lower.
NordFX Analytical Group
Disclaimer: These materials are not an investment recommendation or a guide for working on financial markets and are for informational purposes only. Trading on financial markets is risky and can lead to a complete loss of deposited funds.

