What should traders watch after a strong oil rally?
Short answer: Check whether the latest decline is changing the structure of the broader move. A weekly chart shows the recovery in context, a daily chart identifies the areas being tested, and H4 reveals how the pullback is developing. Compare those observations with changes in supply and demand expectations before deciding whether there is a trade that fits your approach.
Oil can remain well above its earlier lows while falling sharply over a few sessions. For someone following energy headlines, this can be confusing: the reasons for watching the market still exist, yet the latest candles point down.
The USOIL example below shows how to work through that situation. The question is what would need to happen next to strengthen, weaken or change a trading view.
Why the oil story can change before physical supplies do
In early November 2026, oil traders are assessing both supply disruptions and the possibility of diplomatic progress in the Middle East. On 2 November, oil declined in early trading as hopes for progress in US–Iran diplomacy eased some immediate concerns about escalation, according to Associated Press.
This illustrates an important feature of oil pricing. A price can include an allowance for the possibility of future disruption, often called a geopolitical risk premium. When the perceived threat changes, that premium can shrink before any additional barrels reach the market. Prices can therefore fall even while the underlying supply situation remains difficult.
Demand also matters. The IEA’s October Oil Market Report described a fragile supply recovery alongside weaker consumption caused by high fuel prices and deteriorating economic conditions. Supply pressure and demand weakness can exist at the same time; their relative importance can shift as new information arrives.
Production announcements need similar care. On 1 November, seven OPEC+ countries maintained their September required production levels for December. A production target is a policy commitment, while the amount actually produced and delivered depends on operational and transport conditions.
For a trader, the useful question is what has changed in the outlook: expected demand, available supply, transport routes or the likelihood of disruption. The next step is to examine how price is behaving around relevant areas on the chart.
The following charts show USOIL before the 2 November news update, providing a case study in how to compare price structure across timeframes.
The weekly chart puts the rally in context
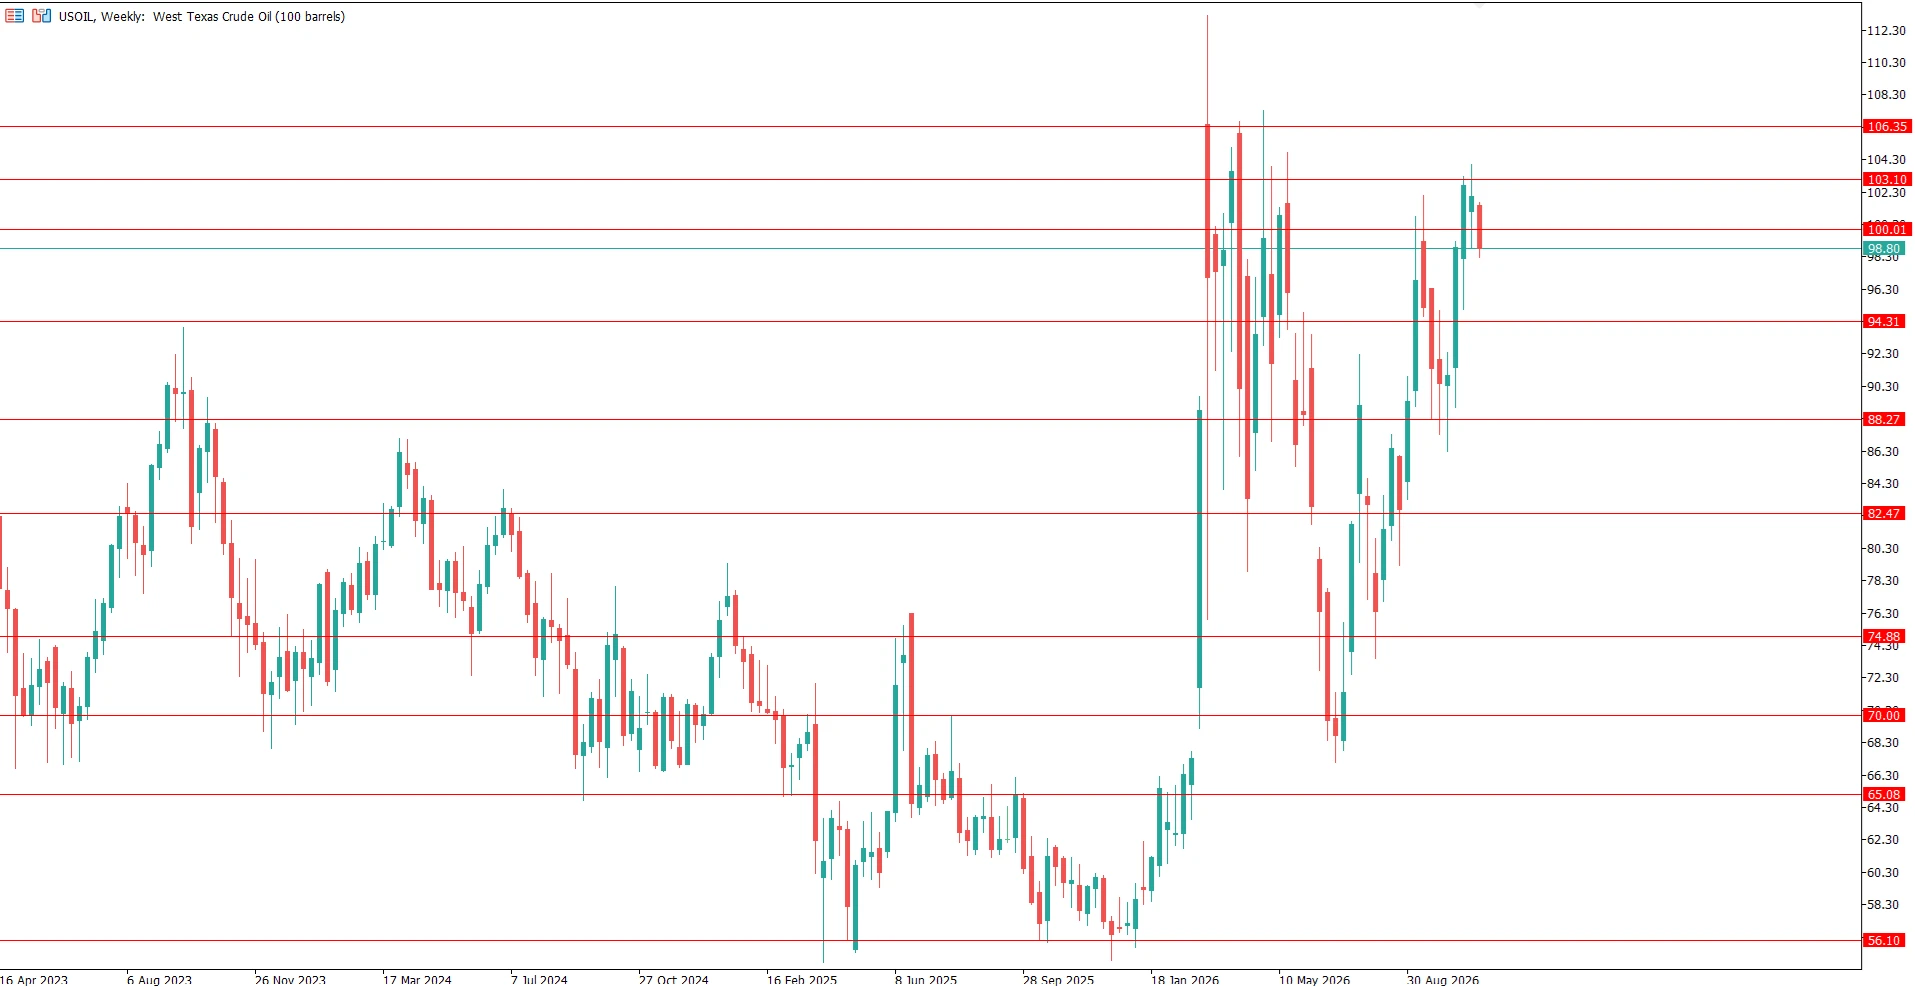
USOIL weekly chart showing a recovery towards 103.10 after an earlier decline
USOIL weekly chart in MetaTrader. The screenshots in this article are historical snapshots showing quotes around 98.55–98.57, not live prices. Levels refer to this USOIL feed.
The weekly chart shows a substantial recovery from the area around 70 towards 103.10. It also shows how abruptly oil changed direction earlier in the year. Both observations matter: the recent rally is significant, but the market has already demonstrated that strong moves can reverse.
The latest decline has not, by itself, erased the recovery visible over several months. Equally, the existence of that recovery does not establish that the next move must be higher.
This is the weekly chart’s role: it helps distinguish the size of the latest move from its importance within the broader structure. A few falling H4 candles can look dramatic while still occupying a relatively small part of the weekly chart.
The daily chart shows where the rally is being challenged
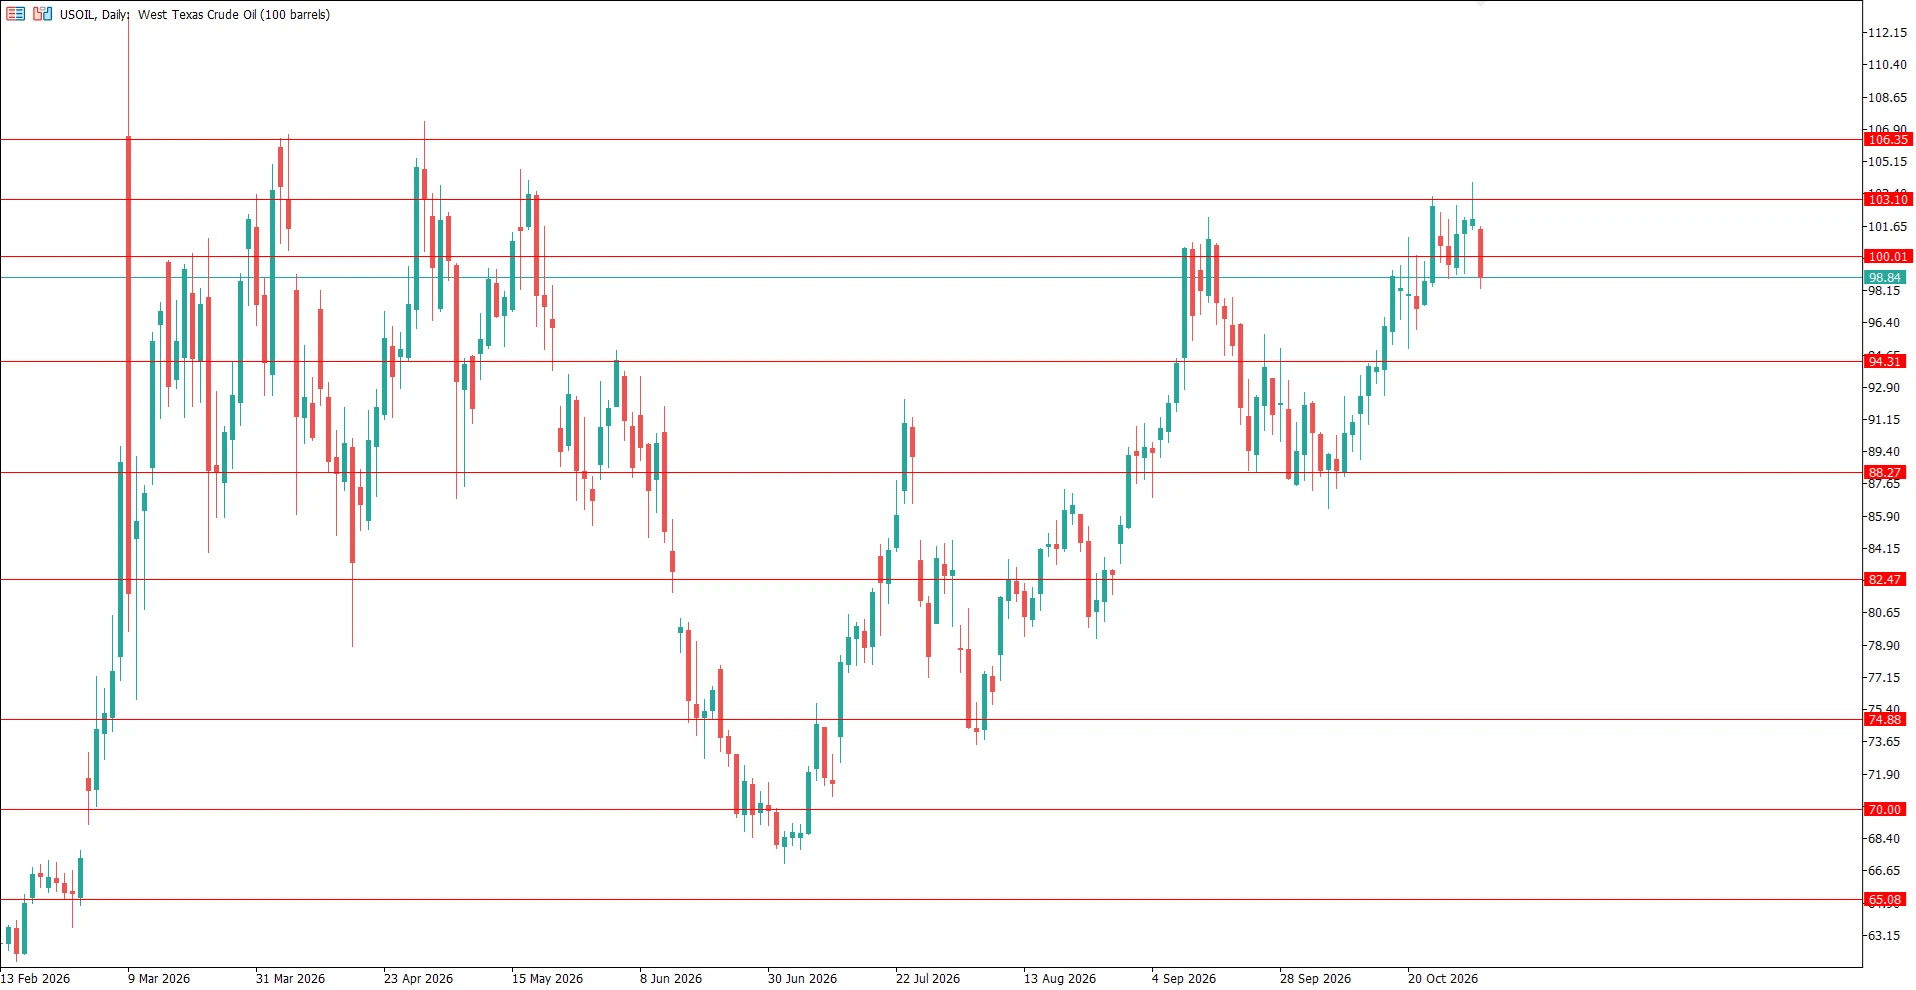
USOIL daily chart showing the October advance towards 103.10 and the subsequent decline
USOIL daily chart. The marked areas provide reference points for examining the pullback.
On the daily chart, the advance from the October low approaches the marked 103.10 area before price retreats towards 98.55. The chart also contains previous reactions around this upper region, making it a useful place to assess whether buying remains strong enough to sustain the move. It also displays a pin bar.
Below the displayed price, 94.31 and 88.27 are further marked reference areas. They help organise the analysis if the decline extends. Their presence on the chart does not mean price must reach them or bounce from them.
The practical question is how price behaves as it approaches an area. Does the decline slow and begin to form a base? Does a rebound hold above its previous low? Or do rebounds fade while the market continues to make lower lows?
Those developments provide more information than the first touch of a horizontal line. Understanding the difference between a breakout and a reversal helps avoid treating every crossed level as a change in the entire trend.
H4 reveals the change in short term momentum
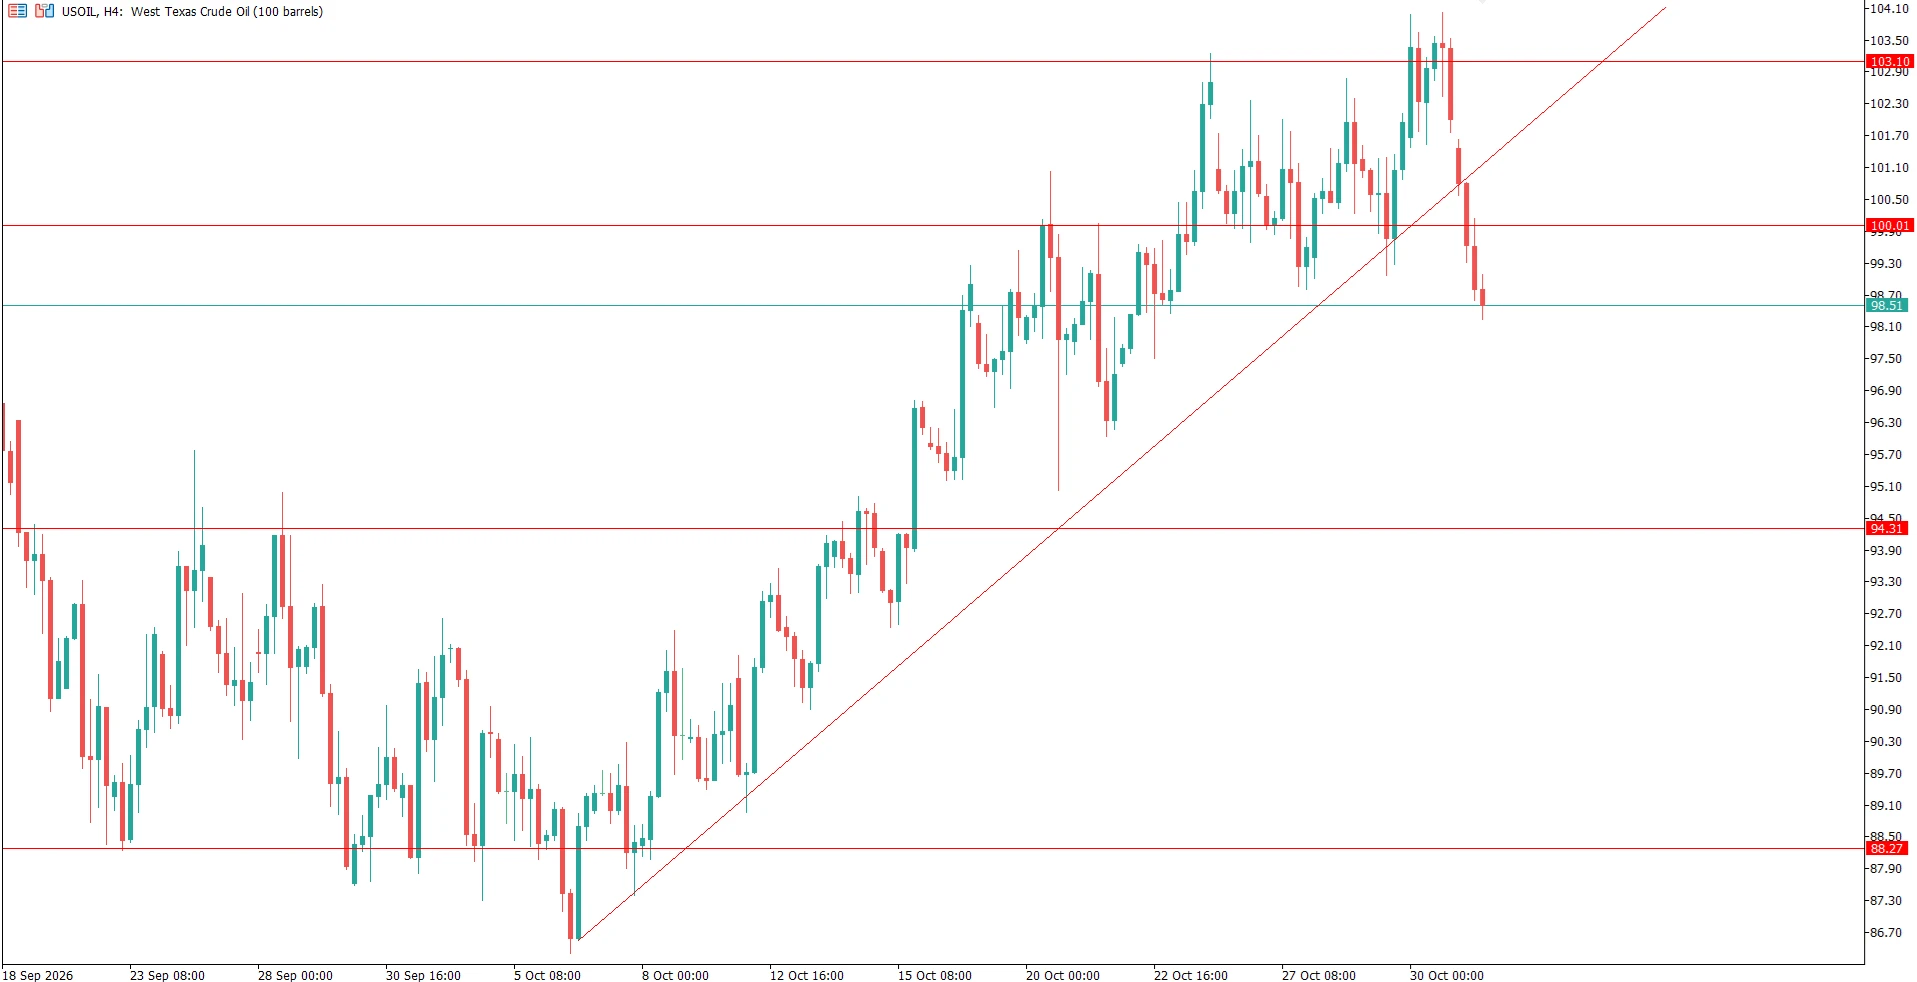
USOIL H4 chart showing price moving below an ascending trendline after testing the 103.10 area
USOIL H4 chart. The recent decline moves below the drawn ascending trendline.
The H4 chart shows the sequence more clearly. Price advances through a series of swings, trades around and briefly above 103.10, then falls sharply towards 98.56. It also moves below the ascending line drawn through the earlier advance.
That is evidence that the recent pace of the rise has changed. It is not enough, on its own, to confirm a lasting reversal on the daily or weekly chart. A trendline depends on the points chosen to draw it; subsequent swing highs and lows help test whether its break reflects a wider change.
The response after the decline is therefore especially useful. A rebound that quickly fades below a recent swing high would leave short term weakness in place. Stabilisation followed by a higher low and a break above a subsequent swing high would provide evidence that buying interest is returning.
What would change the picture from here
A continuation case would become stronger if price stabilised, formed a higher low on H4 and began recovering lost ground. A later move above the 103.10 area that held through a pullback would add evidence.
A deeper correction would become more plausible if rebounds repeatedly stalled below previous swing highs and fresh lows followed. In that case, the daily reference areas around 94.31 and 88.27 would become more relevant to the review. A lower high followed by a break of the preceding daily swing low would provide stronger evidence that the broader recovery was weakening.
A third possibility is consolidation. Price may spend time moving sideways after a sharp decline while traders reassess the news. An unresolved range can justify continued observation; an active oil market does not produce a clear trading situation every session.
These are conditional scenarios based on the chart snapshot. As new candles form, the reference points and the interpretation need to be updated together.
Match the decision to the timeframe
A trader planning to hold a position for several days needs to consider movements that may look large on H4 but remain within the daily structure. Someone trading a shorter move needs an exit plan appropriate to that shorter horizon. Switching to the weekly chart simply to justify keeping an unsuccessful short term trade changes the original decision.
Before opening a position, define the observation that supports the trade and the development that would invalidate it. Position size should follow the planned exposure and exit distance. For CFDs, the same price movement can produce very different monetary results depending on volume and contract size and tick value.
Oil can gap or move rapidly around unexpected announcements, so an intended stop price is not a guaranteed execution price. That makes the size of the position relevant even when the chart scenario looks convincing.
Frequently asked questions
Can oil fall while supply risks remain high?
Yes. Price reflects changing expectations as well as current conditions. Reduced expectations of escalation or weaker expected demand can outweigh continuing supply concerns over a particular period.
Does a broken H4 trendline confirm a weekly reversal?
No. It shows that price has moved outside the path described by that line. A broader reversal requires additional evidence from subsequent swings and the higher timeframe structure.
Can these USOIL levels be used directly for Brent?
No. Brent and WTI are different benchmarks. The method of comparing timeframes can be applied to either, but levels must come from the specific instrument and price feed being traded.
Explore oil trading with NordFX
For eligible new clients, Oil Loss Insurance provides up to $100 in coverage for one qualifying Brent or WTI trade following a single deposit of at least $500. Compensation is credited automatically as real money and can be withdrawn without trading-volume requirements. Eligibility and promotion terms apply.
Explore the offer, open a NordFX account and approach the oil market with a trading plan suited to the conditions you see.
Go Back Go Back
