The quotes of currency pairs, as well as cryptocurrencies, stocks, gold, and other assets, are influenced by many different events taking place in the world. These are parliamentary and presidential elections, decisions of the Central Banks, the release of macroeconomic data, and many other factors. Their description and dates are published in the Economic Calendar on the website of the NordFX broker in the TOOLS section. And this is not accidental, as such a calendar can be a very useful tool with which traders can increase their profits and avoid unpleasant “surprises” that can knock down stop orders and even reset the deposit.
What We See on the Calendar
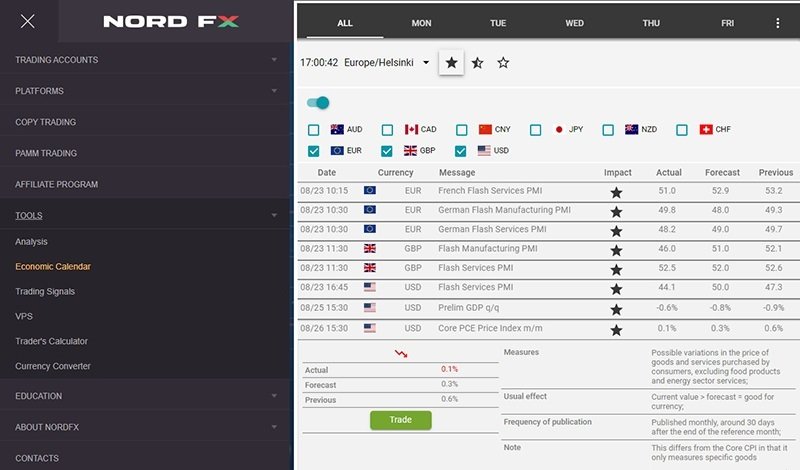
Let's take a closer look at each section of the Economic Calendar. At the very top, you can select a specific day for which you want to view statistics or leave the default "All". In this case, you will have a calendar available for the entire current week.
Clicking on the vertical ellipsis on the right will open the settings menu. There you can:
- set the time of events in accordance with your region;
- sort events by their importance (black asterisk indicates the most important events that can cause high volatility in the market; white asterisk indicates the least important events);
- as well as highlight the countries that are most important for your trading. For example, if you are trading EUR/USD and GBP/USD, you might want to mark only EUR, USD, and GBP so that you don't get distracted by other unnecessary information. (Although, keep in mind that the quotes of these pairs can also be affected by other events, such as those taking place in the Chinese economy).
The Economic Calendar table has the following sections:
- Date. The day and exact time when the event will take place or statistics will be released. Your time zone, as mentioned above, can (and should) be set in the settings.
- Currency. All events taking place in the issuing country of the currency you have selected will be reflected here. Accordingly, they will affect the quotes of those pairs that include this currency, and, possibly, the quotes of cross-pairs .
- Message. This is the event itself. If you click on it, a menu with additional information will open, where you can learn more about what this event is, how it usually affects currency quotes, the frequency of its publication and so on.
- Impact. All events in the Economic Calendar are ranked based on their importance. And the more significant it is, the stronger the market reaction to its result will be.
- Actual. This is the actual value of the indicator after the event has taken place. The direction of the trend or increase in volatility depends on its result.
- Forecast. The predicted value of the indicator. Usually, we pay attention to the forecast in order to understand what the future trend may be.
- Previous. This is the value of the same indicator for the previous reporting period. By comparing forecast indicators with previous ones, you can build your trading strategy on the news.
How to Trade with the Economic Calendar
First of all, as already mentioned, it is necessary to highlight all the most important events for you that will occur during the week or on a specific day. Probably, for those who are engaged in piping or scalping, both events marked with a completely painted black star, and those that are half painted over, and even those that are not painted over at all will be important. For traders using more relaxed strategies, it may make sense to focus only on the most important events.
Such events, for example, include meetings of Central Banks. These are really very important events, as currencies react quite strongly to changes or hints about future changes in monetary policy. Accordingly, when you find such events in the calendar, you can analyze the situation in advance, get acquainted with the forecasts that are regularly published on the NordFX website, and prepare for work by developing the necessary strategy.
As an example, let us look at the actions of the US Federal Reserve in 2020-2022. During the COVID-19 pandemic, this regulator implemented an easy monetary policy (QE) to support the country's economy, lowered federal borrowing rates and flooded the market with a huge mass of freshly printed dollars. As a result, the stock market began to grow, and the dollar, on the contrary, began to weaken.
The excess money supply caused an unprecedented rise in inflation, and the Fed was forced to roll back the dovish policy of quantitative easing (QE) to combat it and switch to the opposite course, to the hawkish policy of quantitative tightening (QT) and raising interest rates. As a result, the DXY Dollar Index showed impressive gains against a basket of six other major foreign currencies. The US currency began to rise against the euro (EUR), Japanese yen (JPY), British pound (GBP), Canadian dollar (CAD), Swedish krona (SEK), Swiss franc (CHF) and other currencies whose central banks continued to stick to softer policy.
When developing an action plan based on macroeconomic statistics and fundamental analysis, it is imperative to take into account the preliminary market expectations that were reflected in the forecast. At the same time, it happens that the market includes forecasts (and even rumors) into its quotes in advance, and then the event itself does not cause the expected reaction. Suppose, for example, that the market forecast says that the US Federal Reserve may raise interest rates by 0.75% at the next meeting of the FOMC (Federal Open Market Committee). The US currency begins to grow on these expectations. But as a result of the meeting, it turns out that the regulator actually raised the rate not by 0.75%, but by 0.50%. It seems that the rate rose, but the dollar suddenly fell down. Why? Because it did not live up to the expectations that had already been included in its quotes in advance. So it should be taken into account that the actual price movement as a result of this or that event may differ from the statistical average.
When is it better to open trades? If you are working with the Economic Calendar, the best time to open a position is about an hour or half an hour before the news is released. Markets are still calm during this period, and it is possible to open a trade at the current market price. Opening a trade later is already extremely risky, because, firstly, volatility may grow. And secondly, market spreads usually rise during such periods. Therefore, such trading is usually discouraged or prohibited by brokers. (This recommendation does not apply to scalping and scalping strategies).
"Black Asterisks" of the Calendar
What events should you pay close attention to? As already mentioned, to those that are marked in the calendar with a completely painted black asterisk, first of all, these are meetings of the Central Banks. Even if the interest rate does not change, the Central Bank always has a set of tools for regulating monetary policy. It is also very important to follow the comments of representatives and heads of the regulators. They may indicate future directions and possible actions of the Central Bank.
Typically, macroeconomic statistics are collected for the past month, quarter, or year. You can see data on the GDP of a country in the calendar. However, GDP data is a lagging factor. Indices such as the Purchasing Managers Index (PMI) are leading in this case. These indicators reflect the state of affairs in the industry and the service sector based on surveys of purchasing managers, and are a barometer of the economy, indicating its growth or recession.
The next important group of indicators is inflation data. This is, for example, the CPI Consumer Price Index, which records changes in the price level for a group of goods and services over the past reporting period. Thus, the CPI is an early indicator of consumer inflation, and reflects changes in the cost of living in the country and the purchasing power of the national currency. The state of the consumer market is also indicated by data on retail sales.
Another important segment of the economy is the labor market. This is usually data on unemployment, the number of new jobs (for example, NFP, Nonfarm Payrolls in the US), and changes in the level of wages. Such statistics can have a strong impact on quotes, since achieving an optimal level of employment and reducing inflation is one of the main tasks of national regulators.
Black Days of the Calendar
When working with the Economic Calendar, it must be understood that it is impossible to foresee in advance such force majeure events as, for example, the outbreak of hostilities, natural disasters, terrorist acts, major political scandals or unexpected decisions of regulators.
For example, let us recall:
- the war in Iraq in 2003 and Russia's invasion of Ukraine in 2022, which caused energy crises,
- the tsunami that caused the disaster at the Japanese nuclear power plant "Fukushima Daiichi" in 2011,
- terrorist air attack on the World Trade Center in New York in 2001,
- the sex scandal that led to the resignation of the British Prime Minister in 2022,
- "Black Thursday" on January 15, 2015, when, due to the decision of the National Bank of Switzerland, the revaluation of the franc by 40% led to the bankruptcy of many major players in the financial market in a matter of seconds.
All these force majeure events, like many others, can either make you rich (if you have an open position in the right currency in the right direction at such a moment), or ruin you if the circumstances are unfortunate. Therefore, we consider it necessary to remind you about money management and stop-loss orders. And take-profit orders should not be neglected either: you may not have time to close a profitable position, and the price, turning around, will go in the opposite direction.
Who Else Needs an Economic Forex Calendar
Although this tool is often called a Forex calendar, it will be useful not only for those who trade currencies, but also for those who conduct transactions with cryptocurrencies, stock indices, company shares, gold, silver, and oil. Why? Compare the charts of these assets, and you will answer this question yourself. All markets are related to each other more or less by direct or inverse correlation. For example, inflation in the US forces the Fed to raise interest rates, which leads to a rise in the dollar, but reduces the quotes of risky assets such as stocks and cryptocurrencies.
Such a tool as a calendar is also necessary for those who work exclusively with graphical and technical analysis. The fact is that volatility increases significantly on the market during the publication of important macro statistics, which breaks graphical patterns and drives indicators crazy. The calendar in this case will help the trader to stay out of the market during such turbulent periods and, thereby, reduce the risks of losing capital.
Go Back Go Back
