What is a bullish harami?
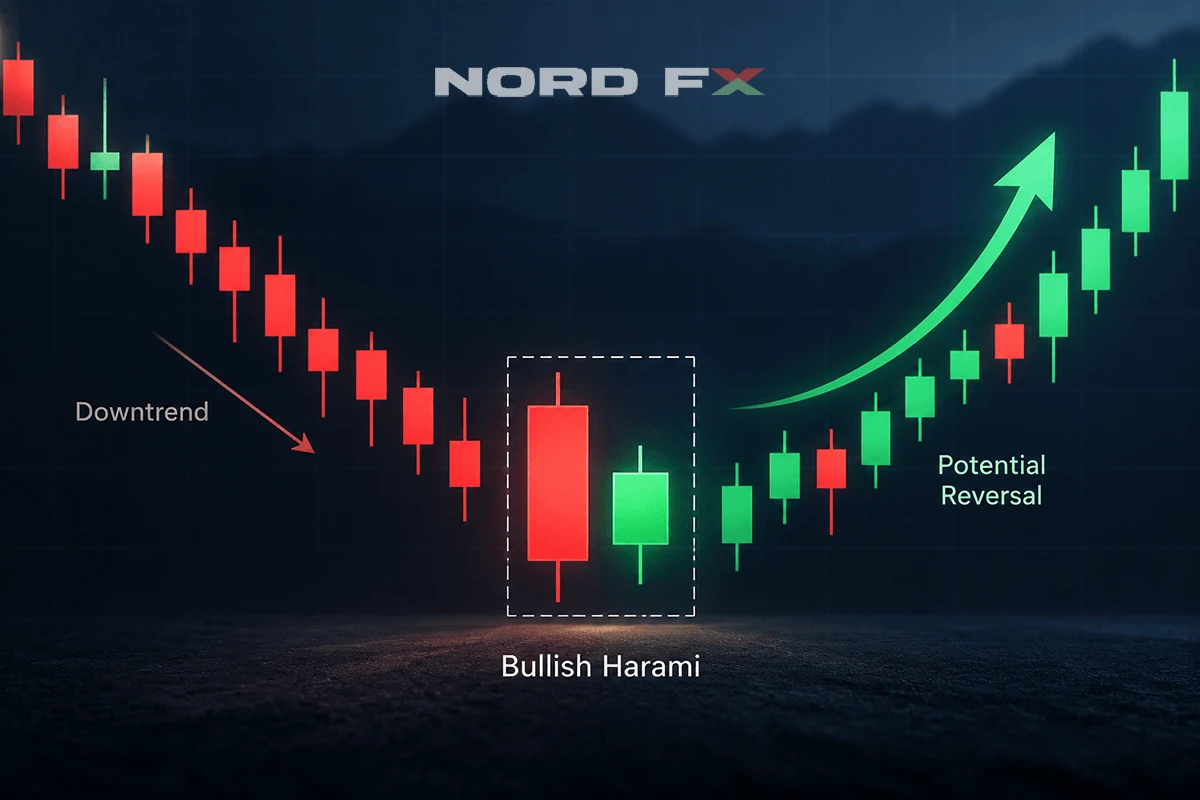
A bullish harami is a two-candlestick pattern that forms after a price decline and may signal weakening selling pressure. It consists of a large bearish candle followed by a smaller candle whose real body sits within the first candle’s body. Traders often look for additional confirmation before treating it as a potential bullish reversal signal.
What is a bullish harami, and what can it tell traders about price action? A bullish harami is a two-candle pattern that appears after a price decline and may indicate that bearish momentum is weakening. It does not guarantee a reversal, but it can alert traders to a possible shift from selling pressure toward greater buying interest.
The bullish harami candlestick pattern consists of a relatively large bearish candle followed by a smaller candle whose real body sits within the real body of the previous candle. Traders generally use the pattern as a potential reversal signal, but its practical value depends on its location, the surrounding trend, confirmation, volatility, and broader market context.
Key takeaways:
- A bullish harami normally forms after an established downward price move.
- It contains a large bearish candle followed by a smaller candle contained within the first candle's body.
- The pattern reflects a loss of bearish momentum rather than proof that buyers have taken control.
- Confirmation from subsequent price action can make the setup more meaningful.
- Bullish harami signals can fail, so traders should consider support levels, market structure, and risk management rather than using the pattern alone.
What Is a Bullish Harami?
A bullish harami is a two-candlestick formation that traders watch for near the end of a downward move. Its main purpose is to highlight a possible slowdown in selling pressure and a potential transition toward a bullish reversal or consolidation.
The word "harami" is commonly associated with the idea of one candle being contained inside another. Visually, the larger first candle surrounds the body of the smaller second candle.
The basic formation has two components:
- The first candle is a relatively large bearish candle that continues the existing decline.
- The second candle has a smaller real body positioned within the first candle's real body.
The second candle may be bullish, and that is the classic form most traders associate with a bullish harami. However, the important feature is the substantial contraction in the candle's body following a strong bearish session.
The pricing logic of a bullish harami
The open and close of each candle explain why the pattern attracts attention.
Suppose an asset is declining. One candle opens at 105 and closes at 98, forming a large bearish body. On the next period, price opens at 100 and closes at 102. The second body's entire 100–102 range lies inside the first candle's 98–105 body.
The first period shows strong selling pressure. The second shows that sellers were unable to produce another similarly large decline. Price instead remains within the previous candle's body.
That change in price behaviour is the main information contained in the pattern.
A bullish harami is therefore better interpreted as a warning that bearish momentum may be weakening, rather than as an automatic signal that a new uptrend has begun.
When does a bullish harami fit the market context?
The pattern is most relevant when it appears:
- after a clear downward move;
- near an established support area;
- after an extended period of selling;
- when the second candle shows clear contraction;
- before subsequent candles provide evidence of stronger buying.
It is less useful when price is already moving sideways. An identical two-candle formation inside a narrow range may simply reflect normal market noise rather than a meaningful reversal attempt.
How to identify bullish harami candlestick pattern
To identify a bullish harami candlestick pattern, first confirm that price has been declining, then look for a large bearish candle followed by a smaller candle whose real body remains inside the previous candle's real body.
The surrounding context matters as much as the candles themselves.
Step 1: Identify the preceding decline
A bullish harami is intended to be a potential bullish reversal formation. Without a preceding downward move, there is little bearish trend to reverse.
The decline does not necessarily have to be a long-term bear market. It can also occur during a pullback within a broader uptrend.
Step 2: Find a strong bearish candle
The first candle should represent meaningful selling pressure. Its close is below its open, and its body should generally appear large relative to recent candles.
For example, if EUR/USD has fallen for several periods and then produces another long bearish candle, sellers still appear to control short-term price action.
Step 3: Look for a smaller second candle
The second candle should have a noticeably smaller real body. Its body should fit within the open-to-close range of the previous bearish candle.
The candle's shadows do not always need to remain within the first candle. Traders usually focus primarily on the real bodies when identifying a harami.
Step 4: Evaluate confirmation
The harami itself shows hesitation. Confirmation attempts to answer a different question: are buyers actually beginning to gain control?
Possible confirmation may include:
- price breaking above the high of the second candle;
- a strong bullish candle forming afterward;
- rejection from an established support area;
- improving momentum;
- a break above nearby short-term resistance.
Confirmation can reduce the chance of reacting to every small pause in a downtrend, although waiting for it can also produce a later entry.
Bullish harami identification checklist
Feature | Typical bullish harami characteristic | Why it matters |
Prior price action | Downward move | Establishes a bearish context |
First candle | Large bearish body | Shows strong selling pressure |
Second candle | Smaller body | Indicates contraction in momentum |
Body position | Inside the first candle's body | Creates the harami structure |
Location | Support or extended decline may strengthen context | Helps distinguish meaningful setups from noise |
Confirmation | Subsequent bullish price action | Suggests buyers may be gaining control |
No single condition guarantees a successful reversal. The table should be viewed as an identification framework rather than a mechanical trading rule.
Psychology behind the bullish harami pattern
The psychology behind the bullish harami pattern is based on a change from strong selling pressure to uncertainty. Sellers dominate the first candle, but the much smaller second candle suggests that their momentum is no longer as decisive.
Imagine a market falling from 80 to 70 over several sessions.
Another bearish session opens at 70 and closes at 66. Traders following the existing trend may expect another large decline in the next period.
Instead, the following candle opens at 67 and trades within a relatively narrow range before closing at 68.
This produces an important change in behaviour. Sellers have not disappeared, but they have failed to extend the previous period's momentum.
Three groups may now influence price.
Existing short sellers may begin taking profits. Buyers who were waiting for lower prices may become more active. Other traders may remain on the sidelines until they see stronger confirmation.
This combination can create temporary equilibrium after a one-sided decline.
The second candle therefore represents hesitation more than outright bullish control.
If later candles move higher, that hesitation may develop into a reversal. If sellers return and price breaks lower, the harami may simply have been a pause before the downtrend continued.
This is why market psychology should not be separated from confirmation and context.
Advantages of the bullish harami
One advantage of the bullish harami is that the pattern is visually straightforward once a trader understands the relationship between the two candle bodies. It can provide a structured way to monitor declining markets for early signs of changing momentum.
Another advantage is that it can be applied across different instruments and timeframes where candlestick charts are available, including forex, indices, commodities, shares, and cryptocurrencies.
The pattern also encourages traders to think about price behaviour rather than treating every downward move as permanent. A sharp contraction following a large bearish candle can reveal an important change in short-term order flow.
From a decision-making perspective, the bullish harami can help organise several questions:
- Is the existing decline losing strength?
- Is price approaching support?
- Have sellers failed to continue the previous candle's momentum?
- Is there evidence of bullish confirmation?
- Where would the reversal idea become invalid?
That last question is particularly useful for risk planning. A trader can define conditions under which the setup no longer matches the original thesis rather than assuming a reversal must eventually occur.
The pattern can also complement other forms of analysis. Support and resistance, trend structure, momentum indicators, volume where relevant, or broader market conditions can provide additional context.
Its best fit is therefore generally as one component of a trading decision rather than as an isolated buy signal.
Disadvantages of the bullish harami
The main disadvantage of the bullish harami is that a loss of bearish momentum does not necessarily produce a bullish reversal.
Markets frequently pause before continuing in the same direction. A smaller candle after a large bearish candle may simply represent short-term indecision.
False signals can be particularly common in markets that are highly volatile or moving strongly in one direction. During a powerful downtrend, several apparent reversal formations may appear before price eventually stabilises.
Another limitation is subjectivity. Traders may disagree about how large the first candle should be, how small the second should be, or how much of a preceding decline is required before the pattern becomes meaningful.
Timeframe choice can also affect interpretation. A bullish harami on a five-minute chart may represent only a brief pause, while the same structure on a daily chart reflects a different period of market participation.
Confirmation involves its own trade-off. Entering immediately after the pattern may provide an earlier position but greater uncertainty. Waiting for price to confirm the reversal can provide more information but may result in entering at a less favourable price.
The pattern may be a poor fit when:
- there is no clear preceding decline;
- the market is trading randomly within a narrow range;
- the pattern forms directly below strong resistance;
- volatility makes candle relationships unreliable;
- a trader is using the pattern without an invalidation or risk-management plan.
A frequent objection to candlestick patterns is that two candles cannot predict future prices. That objection highlights an important distinction: the bullish harami should not be treated as a prediction. It describes a specific change in recent price behaviour. Traders then decide whether that information is relevant within the larger market structure.
Common Bullish Harami Pattern Mistakes to Watch out
One of the most common mistakes is identifying every large bearish candle followed by a small candle as a bullish harami. The pattern should generally appear after a meaningful downward move, not randomly anywhere on a chart.
Another mistake is treating the formation as confirmation of a reversal. The harami primarily indicates contraction and uncertainty. Price may still resume its decline immediately afterward.
Traders should also avoid ignoring nearby market structure. A pattern forming near support can have different implications from one forming in the middle of an unstructured range.
Entering without considering invalidation is another potential problem. Even a technically clear bullish harami can fail. Traders therefore need to decide in advance what price behaviour would indicate that the reversal thesis is no longer valid.
Some traders also focus excessively on whether the second candle perfectly matches textbook examples. Real market patterns are rarely identical. The key relationship is a substantial reduction in the real body and containment within the first body's range.
Finally, using too many indicators to confirm the same idea can create unnecessary complexity. Three momentum indicators showing similar information do not necessarily provide three independent confirmations.
A more practical approach is to combine different types of information: the candlestick formation, market structure, relevant price levels, and clearly defined risk.
Bullish Harami Pattern vs. Bearish Harami Candlestick Pattern
The bullish harami and bearish harami share the same basic two-candle structure, but they occur in opposite market contexts.
A bullish harami appears after declining prices and may indicate weakening bearish momentum. A bearish harami appears after rising prices and may indicate weakening bullish momentum.
Characteristic | Bullish harami | Bearish harami |
Typical preceding move | Downtrend or bearish swing | Uptrend or bullish swing |
First candle | Large bearish candle | Large bullish candle |
Second candle | Small body inside first body | Small body inside first body |
Main interpretation | Selling pressure may be weakening | Buying pressure may be weakening |
Potential implication | Bullish reversal or consolidation | Bearish reversal or consolidation |
Useful confirmation | Price moving higher afterward | Price moving lower afterward |
The logic behind both patterns is similar.
In a bullish harami, sellers initially dominate but then lose momentum. In a bearish harami, buyers initially dominate but then lose momentum.
Neither pattern automatically proves that the opposite side has gained control.
For example, suppose an asset rises strongly from 50 to 65. It then produces a large bullish candle from 63 to 67, followed by a small candle from 66 to 65.50 contained within the first candle's body. That may qualify as a bearish harami because strong upward momentum has contracted.
Reverse those conditions after a decline, and the setup becomes a bullish harami.
The comparison also demonstrates why context is essential. The appearance of the two candles alone is not enough. Traders need to know what price was doing before the pattern formed and what happens after it.
FAQs
Is a bullish harami a bullish reversal pattern?
Yes, the bullish harami is classified as a potential bullish reversal candlestick pattern because it normally appears after declining prices. However, the formation itself mainly shows that bearish momentum has weakened. A reversal still requires subsequent buying pressure to develop, so traders often look for confirmation before drawing stronger conclusions.
What does a bullish harami tell traders?
A bullish harami tells traders that the balance between buyers and sellers may be changing. A large bearish candle shows strong selling, while the smaller second candle indicates that sellers could not maintain the same momentum. This may precede a reversal, but it can also lead to consolidation or renewed selling.
Does the second bullish harami candle have to be green?
The classic bullish harami usually features a smaller bullish second candle, but traders may encounter variations. The most important characteristic is that the second candle's real body is substantially smaller and contained within the body of the first bearish candle. Candle colour should therefore be considered together with structure and context rather than in isolation.
How reliable is a bullish harami?
A bullish harami does not have a fixed level of reliability across every market, asset, or timeframe. Its usefulness depends on factors such as the strength of the previous decline, the pattern's location, volatility, market structure, and subsequent confirmation. Traders should therefore avoid assuming that every bullish harami has the same probability of producing a reversal.
What confirms a bullish harami?
Confirmation generally means price action after the pattern provides additional evidence of buying pressure. Examples include a bullish candle, a break above the second candle's high, a move through nearby short-term resistance, or a strong rejection from support. Confirmation does not eliminate risk, but it provides more information than the two-candle pattern alone.
Can a bullish harami appear during an uptrend?
A harami-like candle structure can appear anywhere, but a bullish harami is most meaningful when it follows a downward move. During a broader uptrend, it may appear after a bearish pullback and potentially signal that the pullback is weakening. Without some preceding decline, classifying the formation as a bullish reversal pattern provides less useful information.
What is the difference between a bullish harami and an inside bar?
Both formations involve price contraction, but they use different criteria. A bullish harami primarily compares the real bodies of two candlesticks, while an inside bar usually requires the entire high-to-low range of the second bar to remain within the previous bar's range. An inside bar is also not inherently bullish or bearish; its interpretation depends heavily on context and the direction of any subsequent breakout.
Should traders use the bullish harami by itself?
Using the bullish harami alone can leave important information out of the decision. Traders can consider the preceding trend, support and resistance, price structure, volatility, confirmation, and their planned risk before acting on the pattern. The bullish harami is most useful as evidence of changing momentum rather than as a standalone instruction to enter a trade.
By John Gordon, Market Analyst at NordFX
Go Back Go Back