In the fast-paced world of financial markets, precision and timing are everything—and that’s where the concept of a trading tick comes in. Whether you're a beginner or an experienced trader, understanding what a trading tick is and how it functions can significantly enhance your ability to read the markets and execute smarter trades. This comprehensive guide dives deep into the world of trading ticks, covering everything from tick size and tick charts to advanced strategies and psychological factors that influence trading decisions.
Table of Contents
Key Components of Tick Trading
Psychological Impact of Tick Size on Traders
Key Takeaways
- Definition: A tick is the smallest price increment by which a security can move. Importance: Understanding ticks is crucial for precise market analysis and effective trading strategies.
- Strategies: Tick trading involves leveraging small price movements for profit, often requiring rapid execution and advanced tools.
- Components: Key elements influencing tick trading include market depth, liquidity, bid-ask spread, precision, speed, and transaction costs.
🔗 what
What Is a Tick in Trading?
In financial markets, a tick denotes the smallest possible price movement of a security or financial instrument. This minimal fluctuation is foundational for traders, as it determines the granularity with which they can observe and act upon price changes. For instance, if a stock's price shifts from $50.00 to $50.01, it has moved one tick. The specific value of a tick can vary across different markets and instruments. In the stock market, ticks are typically valued at $0.01, while in futures markets, tick sizes are predefined by the exchange and can differ based on the contract specifications.
🔗 Origins
The Origins of Tick Trading
The concept of tick trading has its roots in the evolution of financial markets, particularly with the advent of electronic trading platforms. Historically, trades were executed on physical trading floors, where price movements were recorded manually. The term "tick" originated from the ticking sound made by the mechanical price counters as they updated transaction prices. With technological advancements, especially the shift to digital platforms, the ability to track and act upon these minimal price movements became more precise and instantaneous. This evolution paved the way for strategies that capitalize on small price changes, giving rise to tick trading as a recognized approach in modern trading.
🔗 How
How Tick Trading Works
Tick trading focuses on exploiting the smallest price movements within the market. Traders who employ this strategy aim to profit from incremental price changes by executing a high volume of trades within short time frames. This approach requires a deep understanding of market dynamics, as well as access to real-time data and advanced trading platforms that can handle rapid order execution. For example, a trader might buy a stock at $100.00 and sell it at $100.01, capturing a one-tick profit. While the profit per trade is minimal, the cumulative effect of numerous successful trades can be substantial. This method is prevalent among day traders and scalpers who seek to leverage market volatility for short-term gains.
🔗 Size
Tick Size: Why It Matters
Tick size refers to the minimum price increment that a security can move. It plays a crucial role in trading for several reasons:
- Bid-Ask Spread: Tick size influences the difference between the highest price a buyer is willing to pay (bid) and the lowest price a seller is willing to accept (ask). Smaller tick sizes can lead to narrower spreads, potentially reducing transaction costs for traders.
- Liquidity: Markets with smaller tick sizes often experience higher liquidity, as the finer price increments allow for more precise order placements. This increased liquidity can result in more efficient price discovery and reduced price volatility.
Market Behavior: The tick size can affect the overall behavior of the market. For instance, larger tick sizes might discourage high-frequency trading strategies, while smaller tick sizes could encourage them.
🔗 TypesTypes of Trading Ticks
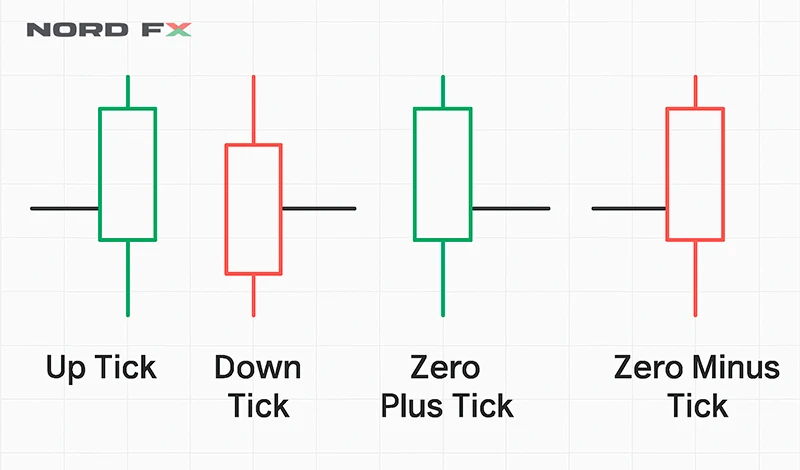
Understanding the different types of ticks is essential for traders aiming to navigate the markets effectively:
- Up Tick: Occurs when a security's price increases compared to its previous transaction.
- Down Tick: Happens when the price decreases relative to the last trade.
- Zero Plus Tick: When the price remains the same as the previous trade but is higher than the last different price.
- Zero Minus Tick: When the price is the same as the previous trade but lower than the last different price.
These distinctions are vital for traders, especially those involved in strategies like short selling, where regulations may dictate the conditions under which such trades can be executed.
🔗 Strategies
Tick Trading Strategies
Tick trading strategies are specifically designed to exploit small, rapid price movements in the market. Traders utilizing these strategies typically focus on short-term profits, executing multiple trades in a single session. This section outlines the most common and effective tick trading strategies, how they work, and when they’re most useful.
📌 Scalping
Scalping is the most popular tick trading strategy. It involves placing a large number of trades throughout the day to profit from very small price changes—sometimes just one tick.
Key Characteristics:
- High frequency: Dozens to hundreds of trades daily.
- Tiny profit per trade: Often 1-2 ticks.
- Tight stop-losses: Scalpers exit quickly if trades don’t go in their favor.
Tools Required:
- Low-latency trading platform (e.g., MT4, MT5).
- Level 2 quotes and tick charts.
- High-speed internet and a direct market access (DMA) broker.
Example:
A trader buys a futures contract at 4320.00 and sells it at 4320.25, earning 1 tick (0.25 point) per contract. If the tick is worth $12.50 (as in the E-mini S&P 500 futures), the trader earns $12.50 before commissions.
📌 Momentum Tick Trading
This strategy involves identifying strong short-term trends and jumping in early to ride the momentum.
Key Characteristics:
- Trade entries: Based on tick chart breakouts.
- Confirmation: Volume spikes and narrow bid-ask spreads.
- Exit strategy: Close position once momentum slows (often using tick chart indicators).
Indicators Used:
- Relative Strength Index (RSI)
- MACD on a 100-tick chart
- Volume profile on tick charts
Ideal Conditions:
- During major market openings or news releases.
- Instruments with high liquidity and volatility like indices or forex pairs.
📌 Reversal Tick Strategy
The reversal strategy tries to identify when a short-term price trend is about to change direction.
Setup:
- Identify overbought/oversold conditions on tick charts.
- Watch for exhaustion in volume.
- Look for double tops/bottoms or divergence on tick-based indicators.
Execution:
- Use tight stop losses to manage risk.
- Confirm reversals with candlestick patterns on the tick chart (e.g., pin bars, engulfing patterns).
📌 Tick Fade Strategy
Fading means trading against the prevailing trend. It’s a contrarian strategy where you sell when price spikes up too fast and buy when price drops suddenly.
Why it works:
- Markets often experience short-term overreactions.
- Other traders take profits after big moves, causing pullbacks.
Entry Signal:
- Large single-tick candle (high volume, long wick).
- Sudden price jump with little follow-through.
Risks:
- Can be dangerous in highly trending markets.
- Requires solid experience and good timing.
📌 VWAP-Based Tick Trading
The VWAP (Volume Weighted Average Price) is used to determine the average price at which a security has traded throughout the day, based on both volume and price.
Strategy:
- Buy when price is below VWAP and starts moving upward.
- Sell when price is above VWAP and shows signs of reversal.
Tick Chart Setup:
- Overlay VWAP on a 100- or 200-tick chart.
- Use it as a dynamic support/resistance level.
🧠 Pro Tip: Combine VWAP with market depth analysis for better entry points.
📌 Breakout Tick Strategy
This strategy involves identifying tight consolidations and placing trades when price breaks out of that range.
Entry Conditions:
- Price forms a narrow range on tick chart.
- Watch for increased volume and speed of ticks.
- Confirm breakout with order flow (large volume on the breakout side).
Stop-Loss and Take-Profit:
- Stop-loss just inside the consolidation range.
- Take-profit at 2x or 3x the size of the range.
Strategy Comparison Table
| Strategy | Risk Level | Ideal Market Condition | Trade Frequency | Avg. Holding Time |
| Scalping | High | Volatile/High Volume | Very High | Seconds to Minutes |
| Momentum Tick Trading | Medium | Trending Market | High | Minutes |
| Reversal Tick Strategy | Medium | Overbought/Oversold | Medium | Minutes |
| Tick Fade Strategy | High | Volatile/Overextended | Medium | Seconds to Minutes |
| VWAP Tick Trading | Low | Sideways/Trending Light | Medium | Minutes to Hours |
| Breakout Tick Strategy | Medium | Consolidation before News | Medium | Seconds to Minutes |
Tick trading demands constant monitoring, quick execution, and solid market awareness. The strategy you choose should match your risk appetite, trading tools, and time availability.
🔗 Read
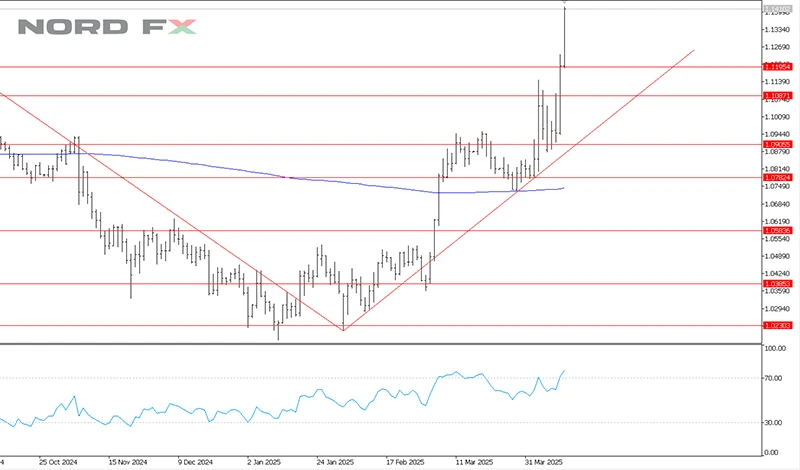
How to Read a Tick Chart
A tick chart is a type of chart that creates a new bar after a specified number of trades, regardless of the time it takes for those trades to occur. Unlike time-based charts, which form bars based on fixed time intervals, tick charts provide a more dynamic view of market activity.
Key Features of Tick Charts
- Trade-Based Formation: Each bar represents a set number of trades (e.g., 100 trades per bar), offering insights into market activity levels.
- Enhanced Market Activity Visualization: During periods of high trading volume, tick charts generate bars more frequently, providing a detailed view of price movements. Conversely, during low activity, bars form less frequently, filtering out market noise.
Advantages of Using Tick Charts
- Improved Trend Identification: Tick charts can reveal trends and patterns that may be obscured in time-based charts, aiding in more accurate market analysis.
- Reduced Market Noise: By focusing on trade occurrences rather than time intervals, tick charts help filter out insignificant price movements, allowing traders to concentrate on meaningful data.
- Better Timing for Entries and Exits: The detailed view provided by tick charts enables traders to identify optimal points for entering and exiting trades.
Practical Example
Consider a 200-tick chart, where each bar represents 200 trades. During a surge in market activity, these bars will form rapidly, reflecting the increased trading volume. In contrast, during quieter periods, bar formation slows down, providing a clearer picture of significant price movements without the clutter of low-activity fluctuations.
🔗 Key
Key Components of Tick Trading
Successful tick trading relies on several critical components that influence trading decisions and outcomes.
Market Depth
Market depth refers to the market's ability to sustain large orders without significantly impacting the price of the security. It provides insights into the supply and demand at various price levels, helping traders understand the liquidity and potential price movements of an asset.
Liquidity
Liquidity measures how quickly and easily an asset can be bought or sold without affecting its price. High liquidity indicates a large number of buyers and sellers, leading to tighter bid-ask spreads and more efficient markets. In tick trading, liquidity is vital for executing trades swiftly and at desired prices.
Bid-Ask Spread
The bid-ask spread is the difference between the highest price a buyer is willing to pay (bid) and the lowest price a seller is willing to accept (ask). A narrower spread typically signifies a more liquid market, reducing trading costs and slippage. Understanding and monitoring the bid-ask spread is crucial for tick traders aiming to capitalize on small price movements.
Precision and Speed
Tick trading demands a high level of precision and speed. Traders must be able to analyze market data quickly and execute orders promptly to take advantage of fleeting opportunities. Utilizing advanced trading platforms and tools that offer real-time data and fast execution capabilities is essential in tick trading.
Transaction Costs
Frequent trading, as seen in tick trading strategies, can lead to substantial transaction costs. These costs include commissions, fees, and the impact of the bid-ask spread. It's imperative for traders to factor in these expenses when formulating their strategies, as they can significantly affect overall profitability.
Understanding these components and how they interact within the market environment enables tick traders to make informed decisions and develop effective trading strategies.
🔗 AdvantagesAdvantages of Tick Trading
Tick trading, which focuses on capitalizing on minimal price movements, offers several benefits to traders who can adeptly navigate its nuances:
Enhanced Market Sensitivity
By concentrating on the smallest price changes, tick traders gain heightened sensitivity to market dynamics. This acute awareness allows for the identification of emerging trends and potential reversals before they become apparent on longer timeframes.
Increased Trading Opportunities
The focus on minor price fluctuations enables traders to execute numerous trades within a single session. This high-frequency approach can lead to multiple profit-making opportunities, especially in volatile markets where price movements are frequent.
Potential for Consistent Profits
While the profit per trade in tick trading is typically small, the cumulative effect of multiple successful trades can result in substantial overall gains. This strategy appeals to traders aiming for steady, incremental profits rather than relying on significant price swings.
Effective in Various Market Conditions
Tick trading strategies can be adapted to various market conditions, including both trending and range-bound markets. This versatility allows traders to remain active and potentially profitable regardless of broader market trends.
🔗 ChallengesChallenges of Tick Trading
Despite its advantages, tick trading presents several challenges that traders must address to be successful:
High Transaction Costs
Executing a large number of trades can lead to significant cumulative transaction costs, including commissions and fees. These expenses can erode profits if not carefully managed.
Requirement for Advanced Technology
Tick trading demands access to real-time data feeds, sophisticated trading platforms, and low-latency execution systems. Investing in and maintaining such technology can be costly and requires a certain level of technical proficiency.
Psychological Pressure
The fast-paced nature of tick trading can exert considerable psychological stress on traders. The need for rapid decision-making and constant market monitoring can lead to fatigue and emotional strain, potentially impacting trading performance.
Market Noise and False Signals
Focusing on minor price movements increases the risk of reacting to market noise or false signals. Distinguishing between meaningful price changes and random fluctuations requires experience and a well-honed analytical approach.
🔗 TradersPsychological Impact of Tick Size on Traders
Tick size—the minimum price movement of a trading instrument—can significantly influence trader behavior and psychology:
Perception of Market Volatility
Smaller tick sizes can make the market appear more volatile due to the increased number of price changes. This perception may lead to heightened anxiety or impulsive trading decisions.
Decision-Making Pressure
In markets with smaller tick sizes, traders may feel compelled to make quicker decisions to capitalize on fleeting opportunities. This urgency can result in rushed judgments and increased susceptibility to errors.
Risk and Reward Assessment
The relationship between tick size and potential profit or loss affects risk management strategies. Smaller tick sizes may encourage traders to take on larger positions to achieve desired profit levels, potentially increasing exposure to risk.
Adaptation to Market Structure
Traders must adapt their strategies to align with the tick size of the instruments they trade. Understanding how tick size impacts order execution, liquidity, and price movement is crucial for effective strategy development.
🔗 FAQ
Frequently Asked Questions (FAQ)
Q: What is tick trading?
A: Tick trading involves executing trades based on the smallest price movements of a security, aiming to profit from incremental changes within short timeframes.
Q: How does tick size affect trading strategies?
A: Tick size influences the granularity of price movements, affecting bid-ask spreads, liquidity, and the precision of entry and exit points. Traders must adjust their strategies to accommodate the tick size of the instruments they trade.
Q: Is tick trading suitable for beginners?
A: Tick trading requires advanced market knowledge, quick decision-making skills, and access to sophisticated trading technology. It may be challenging for beginners and is generally more suited to experienced traders.
Q: What tools are essential for tick trading?
A: Essential tools for tick trading include real-time data feeds, advanced charting software (such as tick charts), low-latency execution platforms, and reliable internet connectivity.
Q: Can tick trading be applied to all financial instruments?
A: While tick trading is commonly associated with highly liquid instruments like major currency pairs, index futures, and large-cap stocks, it can be applied to various financial instruments. However, its effectiveness depends on factors such as liquidity, volatility, and market structure.
Go Back Go Back
