Fibonacci levels have become an integral part of the technical analysis of financial markets. Traders use them as a tool to identify potential support and resistance levels, price pivot points, trend durations, and optimal moments for profit-taking. In the MetaTrader 4 (MT4) platform, among the built-in graphic tools, you can find the Draw Fibonacci retracement option. This tool helps in forecasting the movement of traded assets, based on the assumption that the market moves in cycles and that price corrections often follow the pattern discovered by Leonardo Fibonacci.
A Brief History
The history of the Fibonacci sequence, its remarkable properties, and its connection to the "divine" Golden Ratio were detailed in a separate article. We mentioned that this sequence was introduced into European science in the 13th century by the Italian mathematician Leonardo of Pisa, also known as Fibonacci. It starts with 0 and 1, and each subsequent number is the sum of the two preceding ones (0, 1, 1, 2, 3, 5, 8, 13, 21, 34, 55, 89, 144, 233, 377, 610, 987, 1597, and so forth). In the same article, we discussed the application of this numerical series in various areas of our lives: mathematics, physics, chemistry, cybernetics, architecture, biology, and even music. Now, we will discuss the connection of Fibonacci numbers with Forex, stock, cryptocurrency, and commodity markets.
The use of the Fibonacci sequence in financial markets was not the original idea of the mathematician himself. The application of these principles first to the stock market and then to other financial markets was explored and gained popularity only in the 20th century. One of the first to start using this sequence was Ralph Elliott, the developer of Elliott Wave Theory. However, Fibonacci levels became most widespread thanks to the works of other analysts, whose names we will mention at the end of the article.
Fibonacci Retracement Levels
The most popular tool in technical analysis named after the Italian mathematician is the Fibonacci Retracement levels, which are used to determine the extent of price correction from the main trend. The most common retracement levels are 23.6%, 38.2%, 50%, 61.8%, and sometimes 78.6%. To apply these levels, one must first identify the main trend on the price chart. Then, in the MT4 terminal, the Draw Fibonacci retracement tool is applied to the two extreme points of this trend: the minimum and maximum for an uptrend or the maximum and minimum for a downtrend. The resulting Fibonacci levels on the chart help identify potential zones where the price may experience support or resistance and, accordingly, reverse.
A discerning reader will immediately notice the difference between Fibonacci numbers and Fibonacci retracement levels. At first glance, they seem unrelated, but this is not the case.
– The 23.6% level is derived as a deeper ratio when a number is divided by the number located two places to the right in the sequence.
– The 38.2% level results from dividing a number in the Fibonacci sequence by the number located immediately to its right. For example, dividing 34 by 89 gives approximately 0.382.
– The 61.8% level (or the inversion of 38.2%) is obtained by dividing a number in the Fibonacci sequence by the number that directly follows it. For example, 55 divided by 89 is approximately 0.618.
– The 50% level is not a direct result of applying the Fibonacci sequence, but it is often used in technical analysis due to its simplicity and psychological significance. It has been observed that prices often correct by approximately half of the previous movement.
– The 78.6% level is the square root of 61.8%.
Fibonacci Extension Levels
Fibonacci extension levels are utilized to determine potential levels to which price movement can continue in the direction of the primary trend after a correction. These levels, including 161.8%, 261.8%, and 423.6%, are also based on the assumption that market movements often follow proportions found in nature and mathematics. Extensions assist traders in identifying targets for closing positions or taking profits after a correction is completed. Although not numbers from the Fibonacci sequence, these levels are closely related to it through mathematical properties, especially the Golden Ratio (1.618).
– 161.8% directly results from the Golden Ratio multiplied by 100. This extension level is particularly important as it corresponds to the point where the next price movement can be proportional to the previous trend, multiplied by the Golden Ratio coefficient. In the context of the Fibonacci sequence, if you take any number and multiply it by 1.618, you will approximate the value of the next number in the sequence.
– 261.8% and 423.6% are percentages also related to the Golden Ratio but represent longer or more extreme target levels following a correction. For instance, 261.8% can be derived by multiplying the Golden Ratio (1.618) by itself and then multiplying by 100 to convert it into a percentage. This level indicates a further target for price movement, which may be particularly relevant in strong trends. 423.6% is obtained by further multiplication of the Golden Ratio or through other combinations of Fibonacci numbers multiplied by themselves and by 100. This level represents an even more extreme target, which may be reached in rare cases of very strong trend movements.
Practical Application Tips
Fibonacci retracement and extension levels are a potent tool for the seasoned trader, offering a higher probability of predicting market behaviour. However, it's important to remember that, like any tool, they do not provide 100% guarantees. Therefore, strict risk management discipline must be observed, and they should be used in conjunction with other technical analysis methods and indicators, such as Moving Averages (MA), Relative Strength Index (RSI), MACD, and volume levels, to obtain more reliable signals for entering or exiting trades. It is also important to consider various time frames. For example, Fibonacci levels identified on daily or weekly charts may be more significant than those on shorter time frames, providing stronger support or resistance levels.
Before deciding to enter a trade based on a Fibonacci level, it is advisable to wait for confirming signals, such as candlestick patterns. Additionally, when applying the Draw Fibonacci retracement tool, the correct selection of starting and ending points is crucial. Significant highs and lows, which are clearly defined peaks or troughs on the chart, should be chosen.
It's essential to understand that while Fibonacci levels can provide useful benchmarks, the market does not always respond to them predictably, as they represent a psychological factor rather than a rigid law. Therefore, traders should be prepared for unexpected movements and manage risks accordingly. This can be aided by setting Stop Loss and Take Profit orders. For example, a Stop Loss can be placed just beyond a key Fibonacci level to protect against false breakouts.
Technical Analysis Tools
There are numerous tools based on Fibonacci levels. Fibonacci Retracement is arguably the most popular among traders, which we have already discussed. It is integrated into the MetaTrader 4 terminal, where it is called Draw Fibonacci Retracement. Another tool, Fibonacci Extension, has also been discussed.
Fibonacci Projections is a tool similar to Fibonacci Extension. The difference is that it offers a way to estimate subsequent price movement based on the size and direction of previous waves of movement. To predict future movement, one must select three points in the previous wave: the beginning of the movement, the end of the movement, and the end point of the correction.
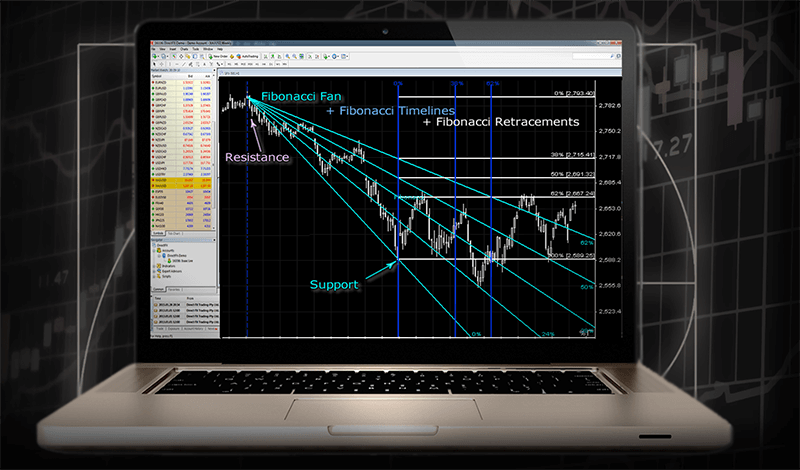
Another tool, Fibonacci Fan, consists of lines drawn from one point (usually a significant minimum or maximum) through the Fibonacci retracement levels on the chart. The fan lines can serve as potential support or resistance lines.
Finally, Fibonacci Time Zones, a rather unusual tool for technical analysis, is used to identify potential reversal moments based on elapsed time. The zones consist of a series of vertical lines placed at specific time intervals, which correspond to the Fibonacci sequence and suggest that important reversal points may occur at these moments.
As stated before, these tools, like any others, do not guarantee an accurate prediction of future price movements. They only provide potential levels to consider when planning trading operations and developing trading strategies. Successful application of the listed tools requires practice, patience, discipline, and a deep understanding of market conditions.
A Bit More History: From the 13th to the 20th Century
The main mathematical treatise, "Liber Abaci" (The Book of Calculation), was written by Fibonacci in 1202, with a revised edition appearing in 1228. This book was dedicated to the exposition and promotion of decimal arithmetic and laid the groundwork for the spread of Indo-Arabic numerals, including the representation of the number zero. In this work, while solving a problem about rabbit population growth, Fibonacci formulated the famous sequence that bears his name and has become his most significant contribution to mathematics.
The Fibonacci sequence found new application in the trading of financial markets in the 20th century, primarily thanks to several traders and financial analysts who studied and used it in their work. Most of them associated Fibonacci levels with price patterns and Elliott Wave Theory. Although Ralph Elliott's work is based on repeating patterns and sequences, it finds a connection with the discussed sequence. Elliott discovered that market wave patterns follow a structure somewhat related to Fibonacci numbers. For instance, dividing waves into fractals of 5 and 3, which sums up to 8, is part of the Fibonacci sequence. Elliott's follower, Robert Prechter, asserting that market waves follow crowd psychology, vividly demonstrated that indeed these patterns can be predicted using Fibonacci numbers.
Larry Pesavento made a significant contribution to popularizing the use of Fibonacci levels in technical analysis. This trading veteran wrote numerous books exploring harmonic price patterns, many of which are closely linked to the sequence of the Italian mathematician. Scott Carney also developed several harmonic patterns, such as the "Butterfly" and the "Crab," based on Fibonacci levels. Philip Carret's contribution should not be forgotten either. The founder of the Pioneer Fund used mathematical principles to analyse markets, and his approach to investing, based on long-term analysis and stock selection, reflected principles similar to the search for the "Golden Ratio."
***
In conclusion, let's present a few statements that reflect the general opinion of many traders and analysts on the significance and usefulness of Fibonacci levels in financial analysis:
– "The Fibonacci sequence is the natural ordering of the universe, and thus it makes perfect sense to apply it to the financial markets to predict future movements."
– "Fibonacci retracement levels are not the holy grail of trading, but they are incredibly useful for understanding market psychology and potential reversals."
– "Fibonacci extensions are invaluable for setting profit targets in a trending market, offering a roadmap to where the price might head next."
Go Back Go Back
